Advertisement
- South Korea
- /
- Electronic Equipment and Components
- /
- KOSDAQ:A148250
Is RN2 Technologies (KOSDAQ:148250) Using Debt Sensibly?
Howard Marks put it nicely when he said that, rather than worrying about share price volatility, 'The possibility of permanent loss is the risk I worry about... and every practical investor I know worries about.' It's only natural to consider a company's balance sheet when you examine how risky it is, since debt is often involved when a business collapses. As with many other companies RN2 Technologies Co., Ltd. (KOSDAQ:148250) makes use of debt. But is this debt a concern to shareholders?
When Is Debt A Problem?
Debt assists a business until the business has trouble paying it off, either with new capital or with free cash flow. Part and parcel of capitalism is the process of 'creative destruction' where failed businesses are mercilessly liquidated by their bankers. While that is not too common, we often do see indebted companies permanently diluting shareholders because lenders force them to raise capital at a distressed price. Of course, plenty of companies use debt to fund growth, without any negative consequences. The first thing to do when considering how much debt a business uses is to look at its cash and debt together.
Check out our latest analysis for RN2 Technologies
How Much Debt Does RN2 Technologies Carry?
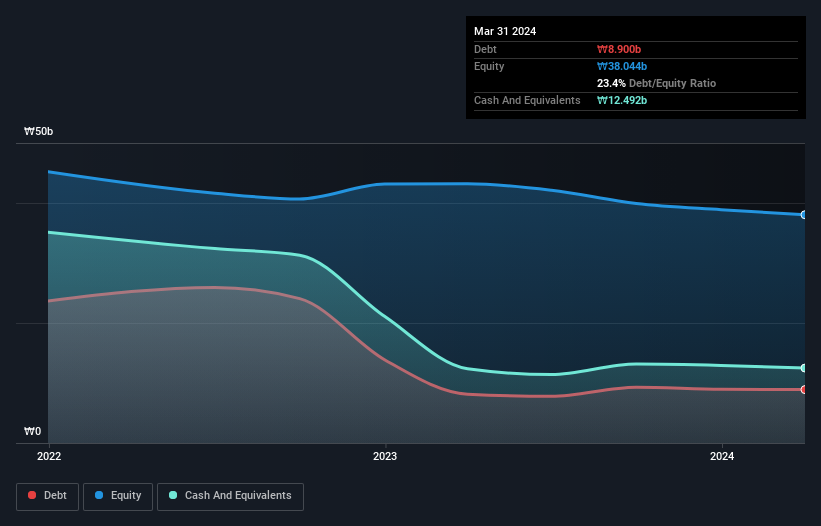
As you can see below, at the end of March 2024, RN2 Technologies had ₩8.90b of debt, up from ₩8.14b a year ago. Click the image for more detail. But on the other hand it also has ₩12.5b in cash, leading to a ₩3.59b net cash position.
A Look At RN2 Technologies' Liabilities
Zooming in on the latest balance sheet data, we can see that RN2 Technologies had liabilities of ₩9.99b due within 12 months and liabilities of ₩548.0m due beyond that. Offsetting this, it had ₩12.5b in cash and ₩4.96b in receivables that were due within 12 months. So it actually has ₩6.92b more liquid assets than total liabilities.
This excess liquidity suggests that RN2 Technologies is taking a careful approach to debt. Because it has plenty of assets, it is unlikely to have trouble with its lenders. Simply put, the fact that RN2 Technologies has more cash than debt is arguably a good indication that it can manage its debt safely. There's no doubt that we learn most about debt from the balance sheet. But it is RN2 Technologies's earnings that will influence how the balance sheet holds up in the future. So when considering debt, it's definitely worth looking at the earnings trend. Click here for an interactive snapshot.
Over 12 months, RN2 Technologies made a loss at the EBIT level, and saw its revenue drop to ₩15b, which is a fall of 36%. To be frank that doesn't bode well.
So How Risky Is RN2 Technologies?
Statistically speaking companies that lose money are riskier than those that make money. And in the last year RN2 Technologies had an earnings before interest and tax (EBIT) loss, truth be told. Indeed, in that time it burnt through ₩921m of cash and made a loss of ₩826m. Given it only has net cash of ₩3.59b, the company may need to raise more capital if it doesn't reach break-even soon. Even though its balance sheet seems sufficiently liquid, debt always makes us a little nervous if a company doesn't produce free cash flow regularly. The balance sheet is clearly the area to focus on when you are analysing debt. But ultimately, every company can contain risks that exist outside of the balance sheet. Be aware that RN2 Technologies is showing 2 warning signs in our investment analysis , and 1 of those is potentially serious...
If, after all that, you're more interested in a fast growing company with a rock-solid balance sheet, then check out our list of net cash growth stocks without delay.
New: AI Stock Screener & Alerts
Our new AI Stock Screener scans the market every day to uncover opportunities.
• Dividend Powerhouses (3%+ Yield)
• Undervalued Small Caps with Insider Buying
• High growth Tech and AI Companies
Or build your own from over 50 metrics.
Have feedback on this article? Concerned about the content? Get in touch with us directly. Alternatively, email editorial-team (at) simplywallst.com.
This article by Simply Wall St is general in nature. We provide commentary based on historical data and analyst forecasts only using an unbiased methodology and our articles are not intended to be financial advice. It does not constitute a recommendation to buy or sell any stock, and does not take account of your objectives, or your financial situation. We aim to bring you long-term focused analysis driven by fundamental data. Note that our analysis may not factor in the latest price-sensitive company announcements or qualitative material. Simply Wall St has no position in any stocks mentioned.
About KOSDAQ:A148250
RN2 Technologies
Engages in the multi-layer components, multi-layer ceramic PCB, and LTCC power material business.
Adequate balance sheet with slight risk.
Similar Companies
Market Insights


Advertisement
Weekly Picks
LO


Lou_Basenese on Virtuix Holdings ·
From a “Shark Tank” Snub to an Air Force “Yes”: Why Virtuix at $3.50 May Be the Market’s Most Mispriced AI Story
Fair Value:US$7.557.6% undervalued
17 followersusers have followed this narrative
0 commentsusers have commented on this narrative
2 likesusers have liked this narrative
IN


Investingwilly on Mastercard ·
Mastercard: The Best Dividend Stock You're Ignoring
Fair Value:US$75034.8% undervalued
65 followersusers have followed this narrative
1 commentusers have commented on this narrative
8 likesusers have liked this narrative
TR


tripledub on Intuit ·
A Wonderful Business at a Not-So-Wonderful Price
Fair Value:US$56054.5% undervalued
63 followersusers have followed this narrative
4 commentsusers have commented on this narrative
29 likesusers have liked this narrative
TA


Talos on MindWalk Holdings ·
The Asymmetric TechBio Play: MindWalk Holdings and the Valuation Disconnect
Fair Value:US$8.2781.6% undervalued
34 followersusers have followed this narrative
0 commentsusers have commented on this narrative
9 likesusers have liked this narrative
Recently Updated Narratives
AN


AntonioS on CAR Group ·
CAR Group. A wonderful compounding franchise at a fair-not-cheap price.
Fair Value:AU$3219.2% undervalued
1 followerusers have followed this narrative
0 commentsusers have commented on this narrative
0 likesusers have liked this narrative
GA

GaryB on Palantir Technologies ·
Palantir hits 52 week low.
Fair Value:US$274.861.0% undervalued
1 followerusers have followed this narrative
0 commentsusers have commented on this narrative
0 likesusers have liked this narrative
NO

North49_ on iShares - iShares MSCI South Korea ETF ·
EWY:US NYSE Arca iShares Msci South Korea ETF, an opportunity to diversify your tech investments.
Fair Value:US$273.4525.0% undervalued
2 followersusers have followed this narrative
0 commentsusers have commented on this narrative
0 likesusers have liked this narrative
Popular Narratives
HA


HarishPK on Adobe ·
Adobe: A Probabilistic Case for Undervaluation
Fair Value:US$319.9639.6% undervalued
61 followersusers have followed this narrative
9 commentsusers have commented on this narrative
18 likesusers have liked this narrative
MA


martinarauz on Nu Holdings ·
Investment Analysis (May 2026)
Fair Value:US$22.7445.2% undervalued
67 followersusers have followed this narrative
0 commentsusers have commented on this narrative
16 likesusers have liked this narrative
IN
Investingwilly on Mastercard ·
Mastercard: The Best Dividend Stock You're Ignoring
Fair Value:US$75034.8% undervalued
65 followersusers have followed this narrative
1 commentusers have commented on this narrative
8 likesusers have liked this narrative
