
Advertisement
- South Korea
- /
- Electronic Equipment and Components
- /
- KOSDAQ:A092460
Hanla IMS' (KOSDAQ:092460) five-year earnings growth trails the 19% YoY shareholder returns

When you buy shares in a company, it's worth keeping in mind the possibility that it could fail, and you could lose your money. But on a lighter note, a good company can see its share price rise well over 100%. Long term Hanla IMS Co., Ltd. (KOSDAQ:092460) shareholders would be well aware of this, since the stock is up 105% in five years. Also pleasing for shareholders was the 32% gain in the last three months.
Since the stock has added ₩15b to its market cap in the past week alone, let's see if underlying performance has been driving long-term returns.
See our latest analysis for Hanla IMS
While the efficient markets hypothesis continues to be taught by some, it has been proven that markets are over-reactive dynamic systems, and investors are not always rational. One way to examine how market sentiment has changed over time is to look at the interaction between a company's share price and its earnings per share (EPS).
During five years of share price growth, Hanla IMS achieved compound earnings per share (EPS) growth of 23% per year. This EPS growth is higher than the 15% average annual increase in the share price. So it seems the market isn't so enthusiastic about the stock these days. The reasonably low P/E ratio of 11.68 also suggests market apprehension.
You can see below how EPS has changed over time (discover the exact values by clicking on the image).
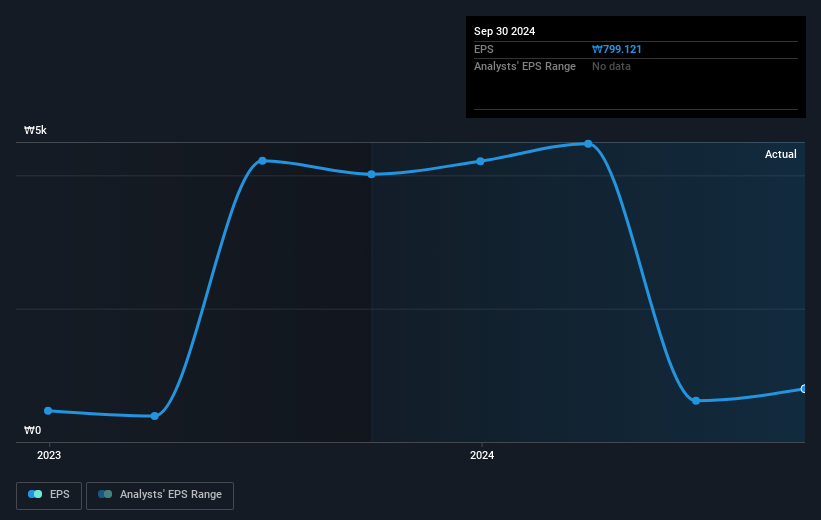
Dive deeper into Hanla IMS' key metrics by checking this interactive graph of Hanla IMS's earnings, revenue and cash flow.
What About Dividends?
As well as measuring the share price return, investors should also consider the total shareholder return (TSR). The TSR is a return calculation that accounts for the value of cash dividends (assuming that any dividend received was reinvested) and the calculated value of any discounted capital raisings and spin-offs. So for companies that pay a generous dividend, the TSR is often a lot higher than the share price return. We note that for Hanla IMS the TSR over the last 5 years was 134%, which is better than the share price return mentioned above. And there's no prize for guessing that the dividend payments largely explain the divergence!
A Different Perspective
It's nice to see that Hanla IMS shareholders have received a total shareholder return of 64% over the last year. Of course, that includes the dividend. That gain is better than the annual TSR over five years, which is 19%. Therefore it seems like sentiment around the company has been positive lately. Someone with an optimistic perspective could view the recent improvement in TSR as indicating that the business itself is getting better with time. It's always interesting to track share price performance over the longer term. But to understand Hanla IMS better, we need to consider many other factors. Consider risks, for instance. Every company has them, and we've spotted 3 warning signs for Hanla IMS you should know about.
For those who like to find winning investments this free list of undervalued companies with recent insider purchasing, could be just the ticket.
Please note, the market returns quoted in this article reflect the market weighted average returns of stocks that currently trade on South Korean exchanges.
Valuation is complex, but we're here to simplify it.
Discover if Hanla IMS might be undervalued or overvalued with our detailed analysis, featuring fair value estimates, potential risks, dividends, insider trades, and its financial condition.
Access Free AnalysisHave feedback on this article? Concerned about the content? Get in touch with us directly. Alternatively, email editorial-team (at) simplywallst.com.
This article by Simply Wall St is general in nature. We provide commentary based on historical data and analyst forecasts only using an unbiased methodology and our articles are not intended to be financial advice. It does not constitute a recommendation to buy or sell any stock, and does not take account of your objectives, or your financial situation. We aim to bring you long-term focused analysis driven by fundamental data. Note that our analysis may not factor in the latest price-sensitive company announcements or qualitative material. Simply Wall St has no position in any stocks mentioned.
About KOSDAQ:A092460
Hanla IMS
Provides integrated systems in South Korea, Singapore, China, and internationally.
Flawless balance sheet low.
Market Insights


Advertisement
Community Narratives
The Future of Drug Testing? Fingerprint Tech Shows Serious Promise
Fair Value US$2.98|43.0% undervalued
JO
Community Contributor
Suncorp’s Next Chapter: Insurance-Only and Ready to Grow
Fair Value AU$22.83|7.6% undervalued
RO
Community Contributor
Thyssenkrupp Nucera Will Achieve Double-Digit Profits by 2030 Boosted by Hydrogen Growth
Fair Value €14.40|30.6% undervalued
CH
Community Contributor
Tesla’s Nvidia Moment – The AI & Robotics Inflection Point
Fair Value US$359.72|18.3% undervalued
BL
Community Contributor