
Advertisement
- South Korea
- /
- Electronic Equipment and Components
- /
- KOSDAQ:A065650
We Think Hyper (KOSDAQ:065650) Has A Fair Chunk Of Debt
David Iben put it well when he said, 'Volatility is not a risk we care about. What we care about is avoiding the permanent loss of capital.' When we think about how risky a company is, we always like to look at its use of debt, since debt overload can lead to ruin. Importantly, Hyper Corporation Inc. (KOSDAQ:065650) does carry debt. But the real question is whether this debt is making the company risky.
Why Does Debt Bring Risk?
Debt and other liabilities become risky for a business when it cannot easily fulfill those obligations, either with free cash flow or by raising capital at an attractive price. If things get really bad, the lenders can take control of the business. However, a more common (but still painful) scenario is that it has to raise new equity capital at a low price, thus permanently diluting shareholders. Of course, the upside of debt is that it often represents cheap capital, especially when it replaces dilution in a company with the ability to reinvest at high rates of return. When we think about a company's use of debt, we first look at cash and debt together.
How Much Debt Does Hyper Carry?
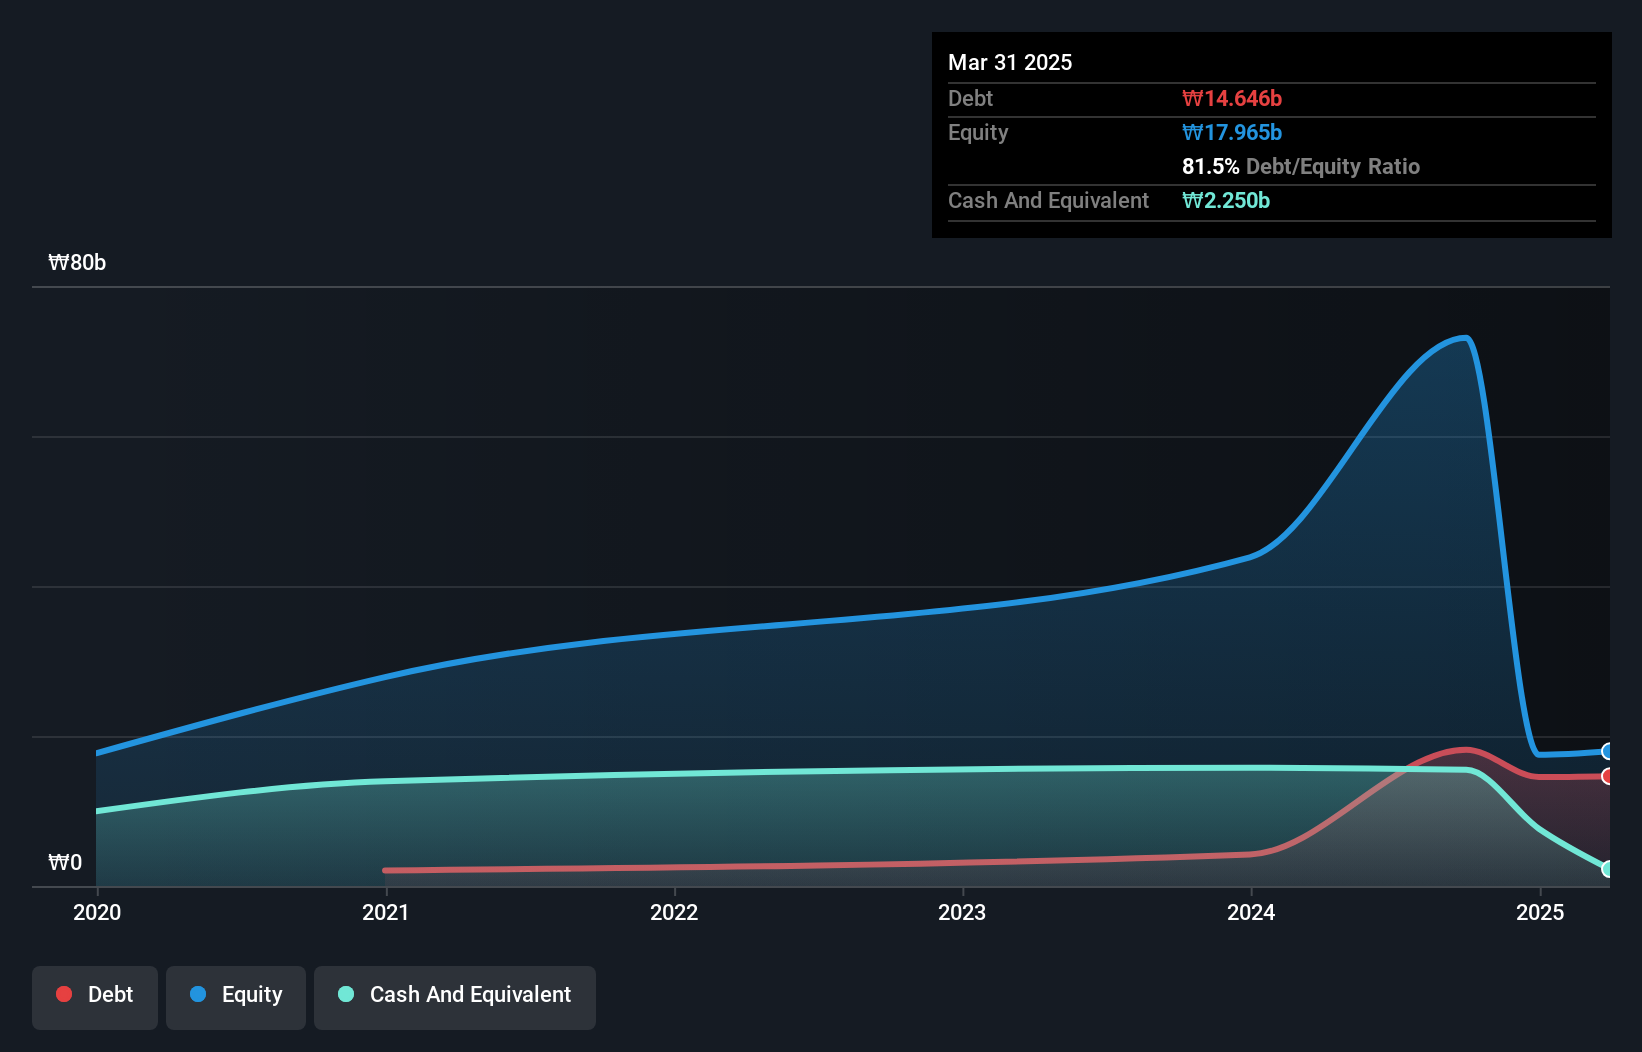
You can click the graphic below for the historical numbers, but it shows that as of March 2025 Hyper had ₩14.6b of debt, an increase on ₩4.20b, over one year. On the flip side, it has ₩2.25b in cash leading to net debt of about ₩12.4b.
How Strong Is Hyper's Balance Sheet?
Zooming in on the latest balance sheet data, we can see that Hyper had liabilities of ₩31.1b due within 12 months and liabilities of ₩5.55b due beyond that. On the other hand, it had cash of ₩2.25b and ₩13.2b worth of receivables due within a year. So its liabilities total ₩21.1b more than the combination of its cash and short-term receivables.
While this might seem like a lot, it is not so bad since Hyper has a market capitalization of ₩36.9b, and so it could probably strengthen its balance sheet by raising capital if it needed to. But we definitely want to keep our eyes open to indications that its debt is bringing too much risk. When analysing debt levels, the balance sheet is the obvious place to start. But it is Hyper's earnings that will influence how the balance sheet holds up in the future. So when considering debt, it's definitely worth looking at the earnings trend. Click here for an interactive snapshot.
Check out our latest analysis for Hyper
In the last year Hyper wasn't profitable at an EBIT level, but managed to grow its revenue by 32%, to ₩63b. With any luck the company will be able to grow its way to profitability.
Caveat Emptor
Despite the top line growth, Hyper still had an earnings before interest and tax (EBIT) loss over the last year. Indeed, it lost a very considerable ₩16b at the EBIT level. Considering that alongside the liabilities mentioned above does not give us much confidence that company should be using so much debt. Quite frankly we think the balance sheet is far from match-fit, although it could be improved with time. Another cause for caution is that is bled ₩12b in negative free cash flow over the last twelve months. So in short it's a really risky stock. The balance sheet is clearly the area to focus on when you are analysing debt. But ultimately, every company can contain risks that exist outside of the balance sheet. These risks can be hard to spot. Every company has them, and we've spotted 5 warning signs for Hyper (of which 3 are significant!) you should know about.
Of course, if you're the type of investor who prefers buying stocks without the burden of debt, then don't hesitate to discover our exclusive list of net cash growth stocks, today.
Valuation is complex, but we're here to simplify it.
Discover if Hyper might be undervalued or overvalued with our detailed analysis, featuring fair value estimates, potential risks, dividends, insider trades, and its financial condition.
Access Free AnalysisHave feedback on this article? Concerned about the content? Get in touch with us directly. Alternatively, email editorial-team (at) simplywallst.com.
This article by Simply Wall St is general in nature. We provide commentary based on historical data and analyst forecasts only using an unbiased methodology and our articles are not intended to be financial advice. It does not constitute a recommendation to buy or sell any stock, and does not take account of your objectives, or your financial situation. We aim to bring you long-term focused analysis driven by fundamental data. Note that our analysis may not factor in the latest price-sensitive company announcements or qualitative material. Simply Wall St has no position in any stocks mentioned.
About KOSDAQ:A065650
Hyper
A clinical stage biopharmaceutical company, focuses on the development of Alzheimer's disease (AD) and neuropathic pain treatments, and AD diagnostics.
Mediocre balance sheet with low risk.
Market Insights

Advertisement
Weekly Picks
WO

woodworthfund on MGP Ingredients ·
THE KINGDOM OF BROWN GOODS: WHY MGPI IS BEING CRUSHED BY INVENTORY & PRIMED FOR RESURRECTION
Fair Value:US$4034.1% undervalued
18 followersusers have followed this narrative
1 commentusers have commented on this narrative
4 likesusers have liked this narrative
DO


Double_Bubbler on Vertical Aerospace ·
Why Vertical Aerospace (NYSE: EVTL) is Worth Possibly Over 13x its Current Price
Fair Value:US$6090.0% undervalued
21 followersusers have followed this narrative
2 commentsusers have commented on this narrative
17 likesusers have liked this narrative
TI


TickerTickle on Oracle ·
The Quiet Giant That Became AI’s Power Grid
Fair Value:US$389.8142.8% undervalued
41 followersusers have followed this narrative
3 commentsusers have commented on this narrative
8 likesusers have liked this narrative
Recently Updated Narratives
MH


mhbb on Mastersystem Infotama ·
Mastersystem Infotama will achieve 18.9% revenue growth as fair value hits IDR1,650
Fair Value:Rp1.63k13.8% undervalued
1 followerusers have followed this narrative
0 commentsusers have commented on this narrative
0 likesusers have liked this narrative
RO


Robbo on Procter & Gamble ·
Insiders Sell, Investors Watch: What’s Going On at PG?
Fair Value:US$1506.8% undervalued
1 followerusers have followed this narrative
0 commentsusers have commented on this narrative
0 likesusers have liked this narrative
CW

Cwburton on Verano Holdings ·
Waiting for the Inevitable
Fair Value:CA$5.5278.8% undervalued
2 followersusers have followed this narrative
0 commentsusers have commented on this narrative
0 likesusers have liked this narrative
Popular Narratives
TH


TheWallstreetKing on MicroVision ·
MicroVision will explode future revenue by 380.37% with a vision towards success
Fair Value:US$6098.5% undervalued
119 followersusers have followed this narrative
11 commentsusers have commented on this narrative
22 likesusers have liked this narrative
AN


AnalystConsensusTarget on NVIDIA ·
NVDA: Expanding AI Demand Will Drive Major Data Center Investments Through 2026
Fair Value:US$250.3926.6% undervalued
962 followersusers have followed this narrative
6 commentsusers have commented on this narrative
25 likesusers have liked this narrative
RO


RockeTeller on Santacruz Silver Mining ·
Crazy Undervalued 42 Baggers Silver Play (Active & Running Mine)
Fair Value:CA$8684.3% undervalued
77 followersusers have followed this narrative
8 commentsusers have commented on this narrative
21 likesusers have liked this narrative
Trending Discussion

OI


OilStates on Oil States International ·
This article is overall well written. However, to correct a few points and to highlight a few additional points: -The shift towards more stable long-cycle offshore and international projects does not increase volatility or exposure to short-cycle markets, quite the opposite. Offshore projects have a much longer investment cycle, duration, and low volatility given these are multi-decade assets. -The article notes a lack of exposure to renewables. Oil States has applied decades of experience in technologies for traditional oil & gas technologies into the renewables sector including transfer of fixed and floating offshore platform technologies into offshore wind, downhole perforating and well completions technologies into geothermal, along with over 50+ renewables projects completed. We are supportive of a broad energy mix, yet to meet growing global energy demand requires both traditional as well as lower carbon resources. Both elements as well as other industrial product orders continue to contribute to Oil States decade-high backlog, which provides significant future revenue visibility. -One of the main storylines not captured here is cash flow generation. 75% of Company revenues (up from 51% in 2022) now come from offshore and international work, which provides good margins. With the strength of the Offshore Manufactured Products business segment, the high-grading of U.S. domestic land activities to focus on higher margin business lines, free cash flow (a non-GAAP metric) has grown significantly ($70 million in free cash flow on a TTM basis as of Sept. 30, 2025). This is quite high for a Company at this market cap, which results in a higher free cash flow yield vs. peers. -Free cash is being used to repurchase shares, to pay down debt (nearing net-debt zero), and to increase returns to stockholders. More detail can be found in our latest investor presentation here: https://ir.oilstatesintl.com/events-and-presentations/default.aspx
0
|0