
Advertisement
- South Korea
- /
- Electronic Equipment and Components
- /
- KOSDAQ:A052020
STCube (KOSDAQ:052020) delivers shareholders notable 71% return over 1 year, surging 21% in the last week alone

These days it's easy to simply buy an index fund, and your returns should (roughly) match the market. But if you pick the right individual stocks, you could make more than that. To wit, the STCube, Inc. (KOSDAQ:052020) share price is 50% higher than it was a year ago, much better than the market return of around 6.4% (not including dividends) in the same period. So that should have shareholders smiling. Zooming out, the stock is actually down 23% in the last three years.
The past week has proven to be lucrative for STCube investors, so let's see if fundamentals drove the company's one-year performance.
Because STCube made a loss in the last twelve months, we think the market is probably more focussed on revenue and revenue growth, at least for now. When a company doesn't make profits, we'd generally hope to see good revenue growth. As you can imagine, fast revenue growth, when maintained, often leads to fast profit growth.
Over the last twelve months, STCube's revenue grew by 64%. That's stonking growth even when compared to other loss-making stocks. The solid 50% share price gain goes down pretty well, but it's not necessarily as good as you might expect given the top notch revenue growth. If that's the case, now might be the time to take a close look at STCube. Human beings have trouble conceptualizing (and valuing) exponential growth. Is that what we're seeing here?
The company's revenue and earnings (over time) are depicted in the image below (click to see the exact numbers).
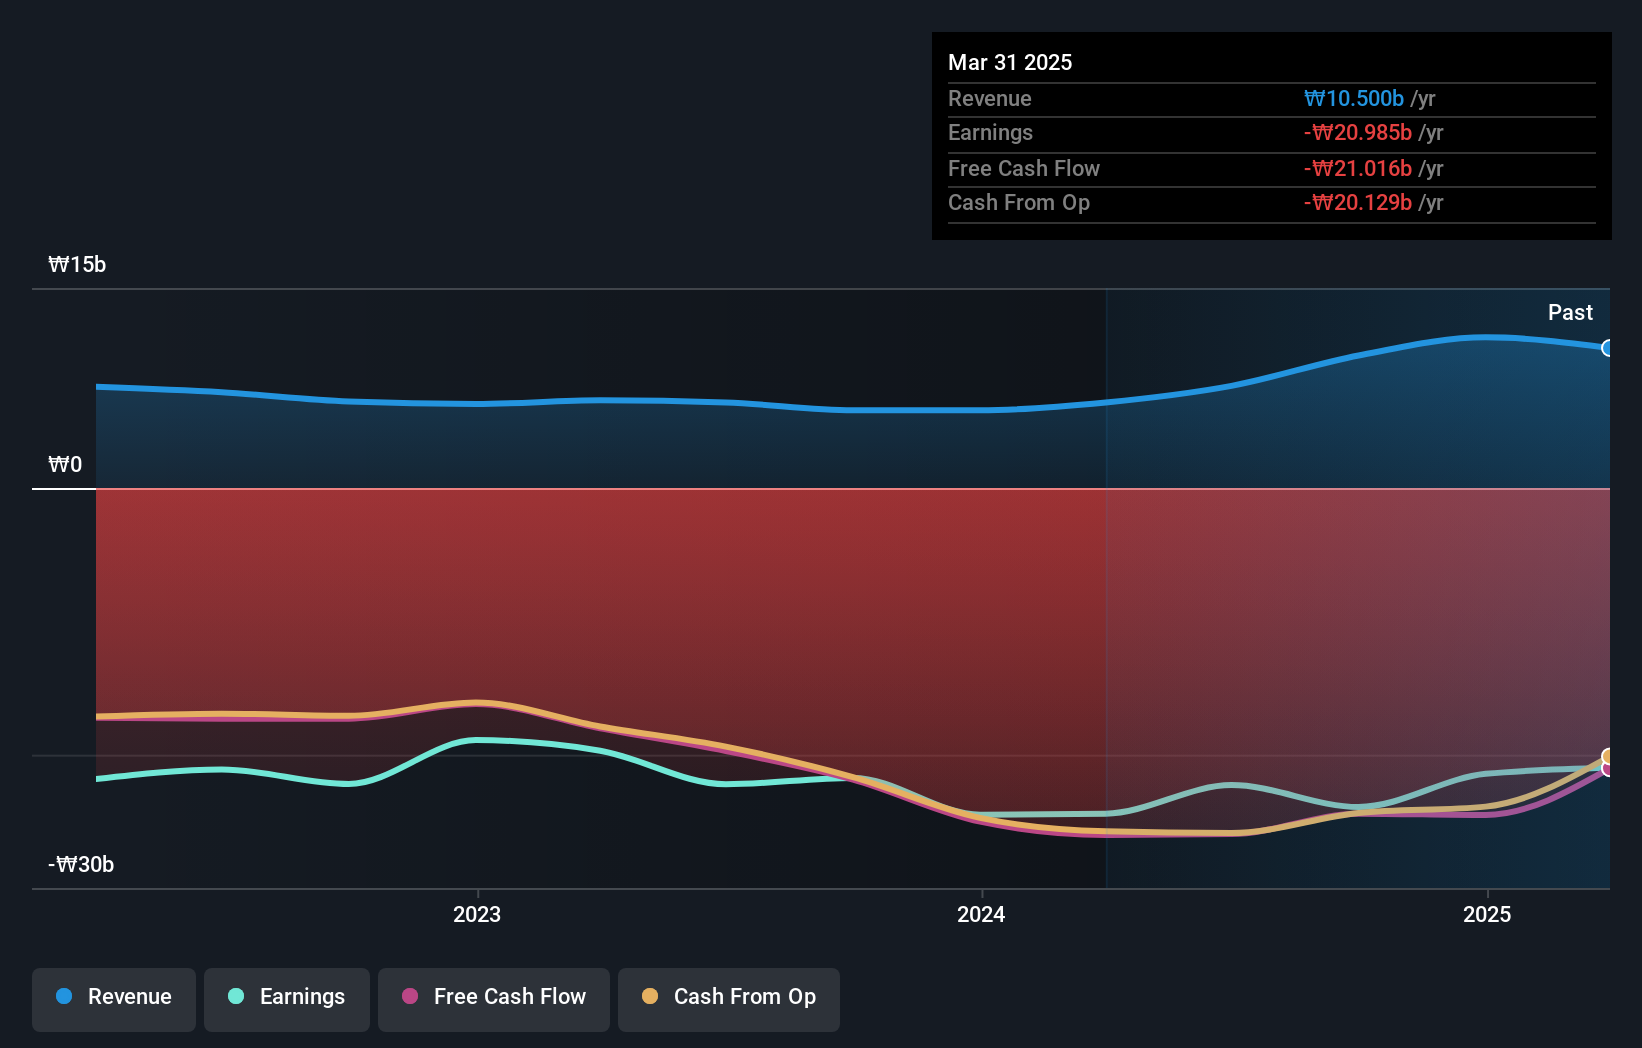
If you are thinking of buying or selling STCube stock, you should check out this FREE detailed report on its balance sheet.
What About The Total Shareholder Return (TSR)?
Investors should note that there's a difference between STCube's total shareholder return (TSR) and its share price change, which we've covered above. The TSR is a return calculation that accounts for the value of cash dividends (assuming that any dividend received was reinvested) and the calculated value of any discounted capital raisings and spin-offs. STCube hasn't been paying dividends, but its TSR of 71% exceeds its share price return of 50%, implying it has either spun-off a business, or raised capital at a discount; thereby providing additional value to shareholders.
A Different Perspective
It's good to see that STCube has rewarded shareholders with a total shareholder return of 71% in the last twelve months. Since the one-year TSR is better than the five-year TSR (the latter coming in at 0.2% per year), it would seem that the stock's performance has improved in recent times. In the best case scenario, this may hint at some real business momentum, implying that now could be a great time to delve deeper. I find it very interesting to look at share price over the long term as a proxy for business performance. But to truly gain insight, we need to consider other information, too. Consider for instance, the ever-present spectre of investment risk. We've identified 3 warning signs with STCube (at least 2 which don't sit too well with us) , and understanding them should be part of your investment process.
If you are like me, then you will not want to miss this free list of undervalued small caps that insiders are buying.
Please note, the market returns quoted in this article reflect the market weighted average returns of stocks that currently trade on South Korean exchanges.
New: Manage All Your Stock Portfolios in One Place
We've created the ultimate portfolio companion for stock investors, and it's free.
• Connect an unlimited number of Portfolios and see your total in one currency
• Be alerted to new Warning Signs or Risks via email or mobile
• Track the Fair Value of your stocks
Have feedback on this article? Concerned about the content? Get in touch with us directly. Alternatively, email editorial-team (at) simplywallst.com.
This article by Simply Wall St is general in nature. We provide commentary based on historical data and analyst forecasts only using an unbiased methodology and our articles are not intended to be financial advice. It does not constitute a recommendation to buy or sell any stock, and does not take account of your objectives, or your financial situation. We aim to bring you long-term focused analysis driven by fundamental data. Note that our analysis may not factor in the latest price-sensitive company announcements or qualitative material. Simply Wall St has no position in any stocks mentioned.
About KOSDAQ:A052020
Flawless balance sheet low.
Market Insights


Advertisement
Community Narratives
For the Emperor: Why Games Workshop Could Be a Star Investment
Fair Value UK£160.00|0.4% overvalued
RO
Community Contributor
Securitas will boost margins with AI and tech-driven services
Fair Value SEK 260.91|44.5% undervalued
UN
Community Contributor
A Leader in EV Charging with Growth Potential
Fair Value €27.00|17.8% undervalued
TI
Community Contributor