- South Korea
- /
- Software
- /
- KOSDAQ:A205100
EXEM Co., Ltd. (KOSDAQ:205100) Stock Is Going Strong But Fundamentals Look Uncertain: What Lies Ahead ?


Most readers would already be aware that EXEM's (KOSDAQ:205100) stock increased significantly by 29% over the past three months. But the company's key financial indicators appear to be differing across the board and that makes us question whether or not the company's current share price momentum can be maintained. In this article, we decided to focus on EXEM's ROE.
Return on equity or ROE is a key measure used to assess how efficiently a company's management is utilizing the company's capital. In short, ROE shows the profit each dollar generates with respect to its shareholder investments.
Check out our latest analysis for EXEM
How Is ROE Calculated?
The formula for return on equity is:
Return on Equity = Net Profit (from continuing operations) ÷ Shareholders' Equity
So, based on the above formula, the ROE for EXEM is:
2.3% = ₩2.8b ÷ ₩121b (Based on the trailing twelve months to September 2024).
The 'return' refers to a company's earnings over the last year. One way to conceptualize this is that for each ₩1 of shareholders' capital it has, the company made ₩0.02 in profit.
What Is The Relationship Between ROE And Earnings Growth?
So far, we've learned that ROE is a measure of a company's profitability. We now need to evaluate how much profit the company reinvests or "retains" for future growth which then gives us an idea about the growth potential of the company. Generally speaking, other things being equal, firms with a high return on equity and profit retention, have a higher growth rate than firms that don’t share these attributes.
EXEM's Earnings Growth And 2.3% ROE
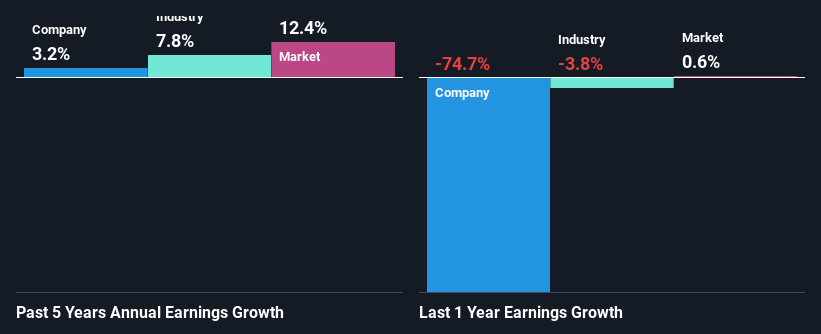
It is hard to argue that EXEM's ROE is much good in and of itself. Even when compared to the industry average of 6.6%, the ROE figure is pretty disappointing. Accordingly, EXEM's low net income growth of 3.2% over the past five years can possibly be explained by the low ROE amongst other factors.
Next, on comparing with the industry net income growth, we found that EXEM's reported growth was lower than the industry growth of 7.8% over the last few years, which is not something we like to see.
The basis for attaching value to a company is, to a great extent, tied to its earnings growth. It’s important for an investor to know whether the market has priced in the company's expected earnings growth (or decline). Doing so will help them establish if the stock's future looks promising or ominous. One good indicator of expected earnings growth is the P/E ratio which determines the price the market is willing to pay for a stock based on its earnings prospects. So, you may want to check if EXEM is trading on a high P/E or a low P/E, relative to its industry.
Is EXEM Making Efficient Use Of Its Profits?
While the company did pay out a portion of its dividend in the past, it currently doesn't pay a regular dividend. We infer that the company has been reinvesting all of its profits to grow its business.
Conclusion
In total, we're a bit ambivalent about EXEM's performance. While the company does have a high rate of reinvestment, the low ROE means that all that reinvestment is not reaping any benefit to its investors, and moreover, its having a negative impact on the earnings growth. Wrapping up, we would proceed with caution with this company and one way of doing that would be to look at the risk profile of the business. To know the 1 risk we have identified for EXEM visit our risks dashboard for free.
Valuation is complex, but we're here to simplify it.
Discover if EXEM might be undervalued or overvalued with our detailed analysis, featuring fair value estimates, potential risks, dividends, insider trades, and its financial condition.
Access Free AnalysisHave feedback on this article? Concerned about the content? Get in touch with us directly. Alternatively, email editorial-team (at) simplywallst.com.
This article by Simply Wall St is general in nature. We provide commentary based on historical data and analyst forecasts only using an unbiased methodology and our articles are not intended to be financial advice. It does not constitute a recommendation to buy or sell any stock, and does not take account of your objectives, or your financial situation. We aim to bring you long-term focused analysis driven by fundamental data. Note that our analysis may not factor in the latest price-sensitive company announcements or qualitative material. Simply Wall St has no position in any stocks mentioned.
About KOSDAQ:A205100
EXEM
Operates as an IT performance management and big data platform company Korea and internationally.
Flawless balance sheet with questionable track record.
Market Insights

Community Narratives


