- South Korea
- /
- Semiconductors
- /
- KOSDAQ:A445090
Some Shareholders Feeling Restless Over ASICLAND Co., Ltd.'s (KOSDAQ:445090) P/S Ratio
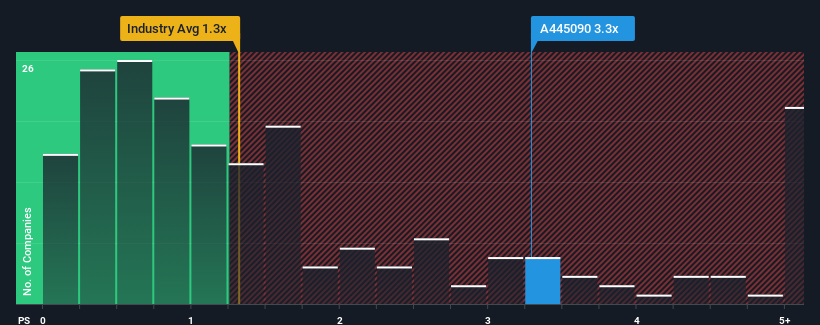
When you see that almost half of the companies in the Semiconductor industry in Korea have price-to-sales ratios (or "P/S") below 1.3x, ASICLAND Co., Ltd. (KOSDAQ:445090) looks to be giving off some sell signals with its 3.3x P/S ratio. However, the P/S might be high for a reason and it requires further investigation to determine if it's justified.
View our latest analysis for ASICLAND

How Has ASICLAND Performed Recently?
The revenue growth achieved at ASICLAND over the last year would be more than acceptable for most companies. It might be that many expect the respectable revenue performance to beat most other companies over the coming period, which has increased investors’ willingness to pay up for the stock. However, if this isn't the case, investors might get caught out paying too much for the stock.
Want the full picture on earnings, revenue and cash flow for the company? Then our free report on ASICLAND will help you shine a light on its historical performance.Is There Enough Revenue Growth Forecasted For ASICLAND?
There's an inherent assumption that a company should outperform the industry for P/S ratios like ASICLAND's to be considered reasonable.
Retrospectively, the last year delivered an exceptional 27% gain to the company's top line. Pleasingly, revenue has also lifted 108% in aggregate from three years ago, thanks to the last 12 months of growth. So we can start by confirming that the company has done a great job of growing revenue over that time.
It's interesting to note that the rest of the industry is similarly expected to grow by 30% over the next year, which is fairly even with the company's recent medium-term annualised growth rates.
With this in mind, we find it intriguing that ASICLAND's P/S exceeds that of its industry peers. It seems most investors are ignoring the fairly average recent growth rates and are willing to pay up for exposure to the stock. Although, additional gains will be difficult to achieve as a continuation of recent revenue trends would weigh down the share price eventually.
What We Can Learn From ASICLAND's P/S?
Typically, we'd caution against reading too much into price-to-sales ratios when settling on investment decisions, though it can reveal plenty about what other market participants think about the company.
We didn't expect to see ASICLAND trade at such a high P/S considering its last three-year revenue growth has only been on par with the rest of the industry. When we see average revenue with industry-like growth combined with a high P/S, we suspect the share price is at risk of declining, bringing the P/S back in line with the industry too. If recent medium-term revenue trends continue, it will place shareholders' investments at risk and potential investors in danger of paying an unnecessary premium.
Many other vital risk factors can be found on the company's balance sheet. You can assess many of the main risks through our free balance sheet analysis for ASICLAND with six simple checks.
If companies with solid past earnings growth is up your alley, you may wish to see this free collection of other companies with strong earnings growth and low P/E ratios.
New: Manage All Your Stock Portfolios in One Place
We've created the ultimate portfolio companion for stock investors, and it's free.
• Connect an unlimited number of Portfolios and see your total in one currency
• Be alerted to new Warning Signs or Risks via email or mobile
• Track the Fair Value of your stocks
Have feedback on this article? Concerned about the content? Get in touch with us directly. Alternatively, email editorial-team (at) simplywallst.com.
This article by Simply Wall St is general in nature. We provide commentary based on historical data and analyst forecasts only using an unbiased methodology and our articles are not intended to be financial advice. It does not constitute a recommendation to buy or sell any stock, and does not take account of your objectives, or your financial situation. We aim to bring you long-term focused analysis driven by fundamental data. Note that our analysis may not factor in the latest price-sensitive company announcements or qualitative material. Simply Wall St has no position in any stocks mentioned.
About KOSDAQ:A445090
ASICLAND
Operates as an application-specific integrated circuit design solution company in South Korea.
Adequate balance sheet with limited growth.
Market Insights
Weekly Picks

THE KINGDOM OF BROWN GOODS: WHY MGPI IS BEING CRUSHED BY INVENTORY & PRIMED FOR RESURRECTION


Why Vertical Aerospace (NYSE: EVTL) is Worth Possibly Over 13x its Current Price


The Quiet Giant That Became AI’s Power Grid
Recently Updated Narratives


Near zero debt, Japan centric focus provides future growth

Corning's Revenue Will Climb by 12.73% in Just Five Years

GE Vernova revenue will grow by 13% with a future PE of 64.7x
Popular Narratives


MicroVision will explode future revenue by 380.37% with a vision towards success


NVDA: Expanding AI Demand Will Drive Major Data Center Investments Through 2026


