
Advertisement
The external fund manager backed by Berkshire Hathaway's Charlie Munger, Li Lu, makes no bones about it when he says 'The biggest investment risk is not the volatility of prices, but whether you will suffer a permanent loss of capital.' So it might be obvious that you need to consider debt, when you think about how risky any given stock is, because too much debt can sink a company. We note that Zaram Technology,Inc. (KOSDAQ:389020) does have debt on its balance sheet. But the real question is whether this debt is making the company risky.
When Is Debt Dangerous?
Debt assists a business until the business has trouble paying it off, either with new capital or with free cash flow. If things get really bad, the lenders can take control of the business. However, a more frequent (but still costly) occurrence is where a company must issue shares at bargain-basement prices, permanently diluting shareholders, just to shore up its balance sheet. By replacing dilution, though, debt can be an extremely good tool for businesses that need capital to invest in growth at high rates of return. The first step when considering a company's debt levels is to consider its cash and debt together.
How Much Debt Does Zaram TechnologyInc Carry?
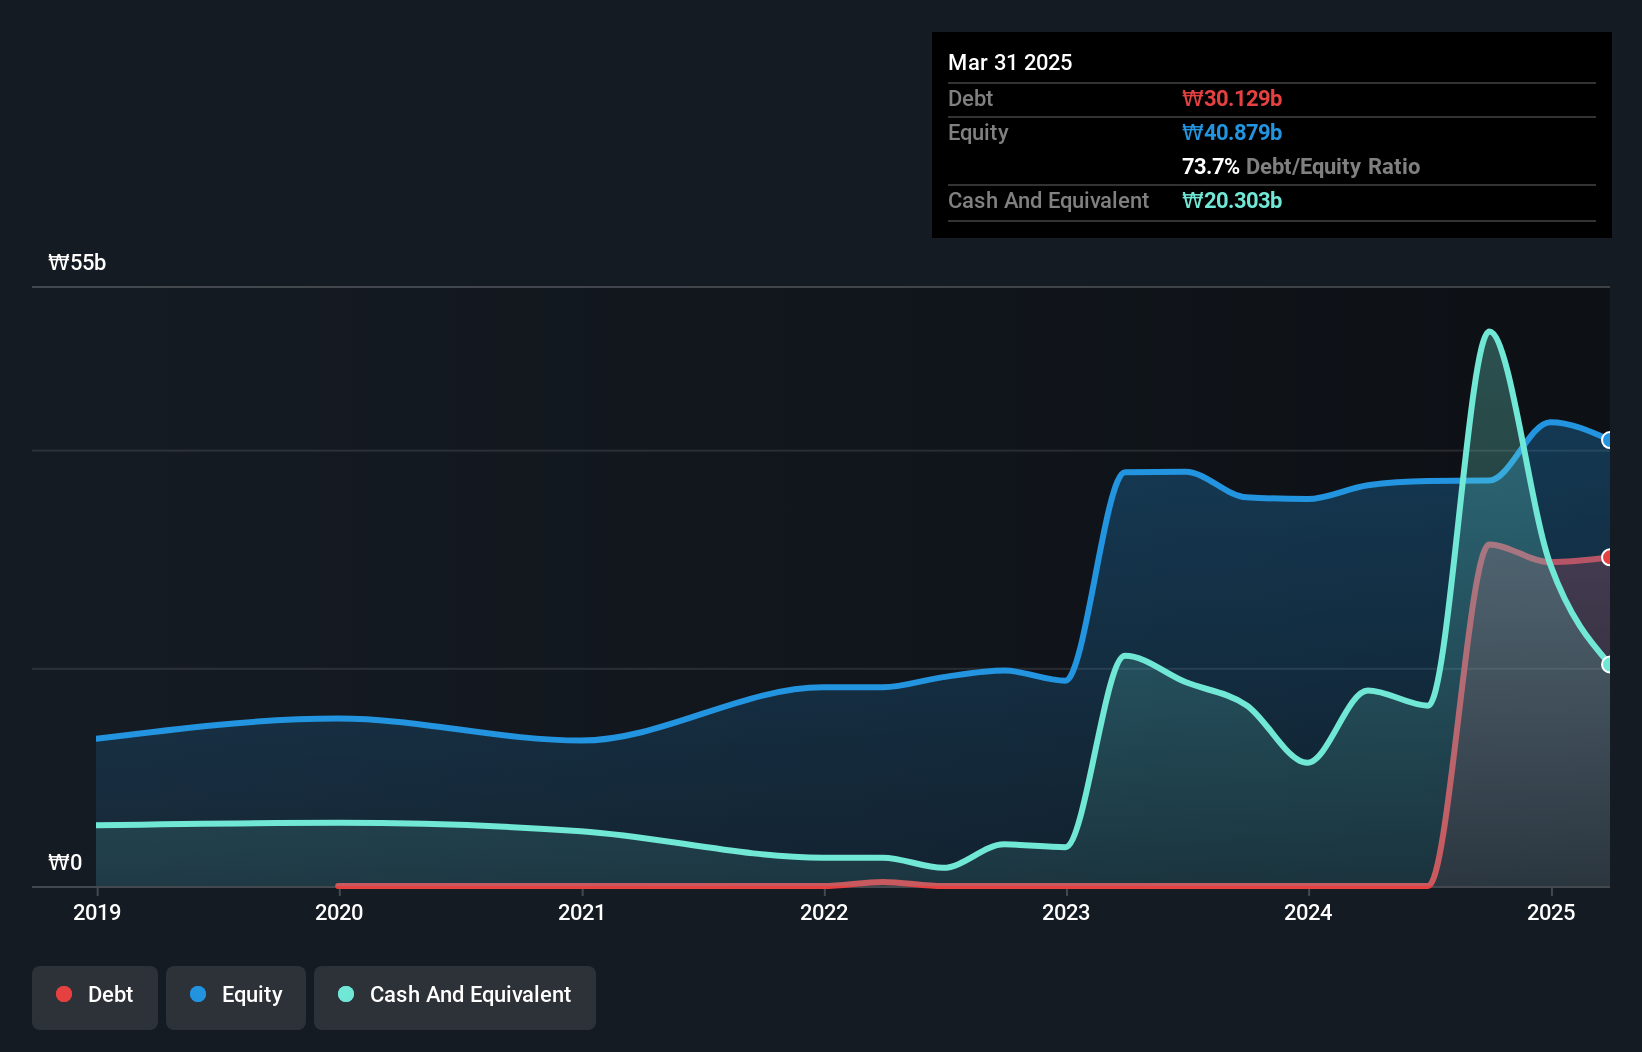
You can click the graphic below for the historical numbers, but it shows that as of March 2025 Zaram TechnologyInc had ₩30.1b of debt, an increase on none, over one year. However, it also had ₩20.3b in cash, and so its net debt is ₩9.83b.
How Healthy Is Zaram TechnologyInc's Balance Sheet?
The latest balance sheet data shows that Zaram TechnologyInc had liabilities of ₩36.3b due within a year, and liabilities of ₩370.0m falling due after that. Offsetting this, it had ₩20.3b in cash and ₩3.63b in receivables that were due within 12 months. So it has liabilities totalling ₩12.8b more than its cash and near-term receivables, combined.
Of course, Zaram TechnologyInc has a market capitalization of ₩215.4b, so these liabilities are probably manageable. Having said that, it's clear that we should continue to monitor its balance sheet, lest it change for the worse. There's no doubt that we learn most about debt from the balance sheet. But it is Zaram TechnologyInc's earnings that will influence how the balance sheet holds up in the future. So when considering debt, it's definitely worth looking at the earnings trend. Click here for an interactive snapshot.
Check out our latest analysis for Zaram TechnologyInc
Over 12 months, Zaram TechnologyInc reported revenue of ₩19b, which is a gain of 17%, although it did not report any earnings before interest and tax. That rate of growth is a bit slow for our taste, but it takes all types to make a world.
Caveat Emptor
Importantly, Zaram TechnologyInc had an earnings before interest and tax (EBIT) loss over the last year. Indeed, it lost ₩1.5b at the EBIT level. When we look at that and recall the liabilities on its balance sheet, relative to cash, it seems unwise to us for the company to have any debt. Quite frankly we think the balance sheet is far from match-fit, although it could be improved with time. However, it doesn't help that it burned through ₩2.0b of cash over the last year. So suffice it to say we do consider the stock to be risky. When analysing debt levels, the balance sheet is the obvious place to start. But ultimately, every company can contain risks that exist outside of the balance sheet. To that end, you should learn about the 2 warning signs we've spotted with Zaram TechnologyInc (including 1 which is a bit concerning) .
At the end of the day, it's often better to focus on companies that are free from net debt. You can access our special list of such companies (all with a track record of profit growth). It's free.
Valuation is complex, but we're here to simplify it.
Discover if Zaram TechnologyInc might be undervalued or overvalued with our detailed analysis, featuring fair value estimates, potential risks, dividends, insider trades, and its financial condition.
Access Free AnalysisHave feedback on this article? Concerned about the content? Get in touch with us directly. Alternatively, email editorial-team (at) simplywallst.com.
This article by Simply Wall St is general in nature. We provide commentary based on historical data and analyst forecasts only using an unbiased methodology and our articles are not intended to be financial advice. It does not constitute a recommendation to buy or sell any stock, and does not take account of your objectives, or your financial situation. We aim to bring you long-term focused analysis driven by fundamental data. Note that our analysis may not factor in the latest price-sensitive company announcements or qualitative material. Simply Wall St has no position in any stocks mentioned.
About KOSDAQ:A389020
Zaram TechnologyInc
Engages in the manufacture and sale of optical network equipment, semiconductors, and electronic components in Korea.
Mediocre balance sheet with very low risk.
Market Insights

Advertisement
Community Narratives
A formidable player in AI and enterprise computing.
Fair Value US$210.00|12.2% overvalued
CO
Community Contributor
IREN's Bold Moves in Sustainable Bitcoin Mining & AI Data Centers
Fair Value US$72.52|17.1% undervalued
BL
Community Contributor
Cooling the Champions: The Aussie Tech Behind F1's Victories
Fair Value AU$12.40|38.1% undervalued
TR
Community Contributor