
Advertisement
- South Korea
- /
- Semiconductors
- /
- KOSDAQ:A171010
Optimistic Investors Push Ram Technology Co., Ltd (KOSDAQ:171010) Shares Up 31% But Growth Is Lacking
Ram Technology Co., Ltd (KOSDAQ:171010) shareholders would be excited to see that the share price has had a great month, posting a 31% gain and recovering from prior weakness. But the gains over the last month weren't enough to make shareholders whole, as the share price is still down 5.2% in the last twelve months.
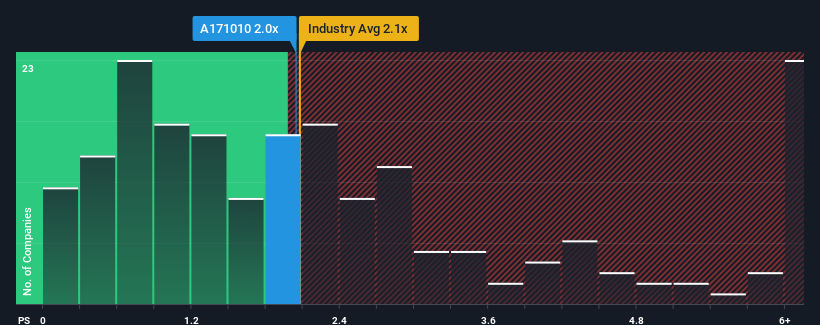
Even after such a large jump in price, it's still not a stretch to say that Ram Technology's price-to-sales (or "P/S") ratio of 2x right now seems quite "middle-of-the-road" compared to the Semiconductor industry in Korea, where the median P/S ratio is around 2.1x. While this might not raise any eyebrows, if the P/S ratio is not justified investors could be missing out on a potential opportunity or ignoring looming disappointment.
Check out our latest analysis for Ram Technology
How Ram Technology Has Been Performing
For instance, Ram Technology's receding revenue in recent times would have to be some food for thought. Perhaps investors believe the recent revenue performance is enough to keep in line with the industry, which is keeping the P/S from dropping off. If you like the company, you'd at least be hoping this is the case so that you could potentially pick up some stock while it's not quite in favour.
We don't have analyst forecasts, but you can see how recent trends are setting up the company for the future by checking out our free report on Ram Technology's earnings, revenue and cash flow.Do Revenue Forecasts Match The P/S Ratio?
There's an inherent assumption that a company should be matching the industry for P/S ratios like Ram Technology's to be considered reasonable.
In reviewing the last year of financials, we were disheartened to see the company's revenues fell to the tune of 36%. This has erased any of its gains during the last three years, with practically no change in revenue being achieved in total. So it appears to us that the company has had a mixed result in terms of growing revenue over that time.
This is in contrast to the rest of the industry, which is expected to grow by 80% over the next year, materially higher than the company's recent medium-term annualised growth rates.
With this in mind, we find it intriguing that Ram Technology's P/S is comparable to that of its industry peers. Apparently many investors in the company are less bearish than recent times would indicate and aren't willing to let go of their stock right now. Maintaining these prices will be difficult to achieve as a continuation of recent revenue trends is likely to weigh down the shares eventually.
What Does Ram Technology's P/S Mean For Investors?
Its shares have lifted substantially and now Ram Technology's P/S is back within range of the industry median. Using the price-to-sales ratio alone to determine if you should sell your stock isn't sensible, however it can be a practical guide to the company's future prospects.
We've established that Ram Technology's average P/S is a bit surprising since its recent three-year growth is lower than the wider industry forecast. When we see weak revenue with slower than industry growth, we suspect the share price is at risk of declining, bringing the P/S back in line with expectations. Unless the recent medium-term conditions improve, it's hard to accept the current share price as fair value.
We don't want to rain on the parade too much, but we did also find 5 warning signs for Ram Technology (2 don't sit too well with us!) that you need to be mindful of.
Of course, profitable companies with a history of great earnings growth are generally safer bets. So you may wish to see this free collection of other companies that have reasonable P/E ratios and have grown earnings strongly.
New: AI Stock Screener & Alerts
Our new AI Stock Screener scans the market every day to uncover opportunities.
• Dividend Powerhouses (3%+ Yield)
• Undervalued Small Caps with Insider Buying
• High growth Tech and AI Companies
Or build your own from over 50 metrics.
Have feedback on this article? Concerned about the content? Get in touch with us directly. Alternatively, email editorial-team (at) simplywallst.com.
This article by Simply Wall St is general in nature. We provide commentary based on historical data and analyst forecasts only using an unbiased methodology and our articles are not intended to be financial advice. It does not constitute a recommendation to buy or sell any stock, and does not take account of your objectives, or your financial situation. We aim to bring you long-term focused analysis driven by fundamental data. Note that our analysis may not factor in the latest price-sensitive company announcements or qualitative material. Simply Wall St has no position in any stocks mentioned.
About KOSDAQ:A171010
Ram Technology
Engages in the manufacturing and selling of electronic chemical materials in South Korea.
Low risk and slightly overvalued.
Market Insights

Advertisement
Community Narratives
Kodiak AI - a potential 100 bagger opportunity?
Fair Value US$14.00|44.7% undervalued
DA
Community Contributor
A Fair Price for a Great Business Facing Real Threats
Fair Value US$383.06|13.0% undervalued
IM
Community Contributor
AXON And Shopify Integration Will Unlock Global Mobile Advertising
Fair Value US$646.30|0% overvalued
AN
Based on Analyst Price Targets