
Advertisement
- South Korea
- /
- Semiconductors
- /
- KOSDAQ:A161580
Philoptics Co., Ltd. (KOSDAQ:161580) May Have Run Too Fast Too Soon With Recent 29% Price Plummet

Unfortunately for some shareholders, the Philoptics Co., Ltd. (KOSDAQ:161580) share price has dived 29% in the last thirty days, prolonging recent pain. Looking at the bigger picture, even after this poor month the stock is up 79% in the last year.
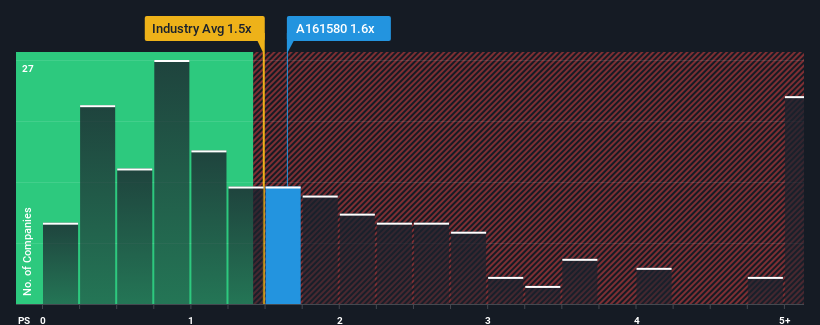
Even after such a large drop in price, you could still be forgiven for feeling indifferent about Philoptics' P/S ratio of 1.6x, since the median price-to-sales (or "P/S") ratio for the Semiconductor industry in Korea is also close to 1.5x. Although, it's not wise to simply ignore the P/S without explanation as investors may be disregarding a distinct opportunity or a costly mistake.
See our latest analysis for Philoptics
What Does Philoptics' Recent Performance Look Like?
For instance, Philoptics' receding revenue in recent times would have to be some food for thought. It might be that many expect the company to put the disappointing revenue performance behind them over the coming period, which has kept the P/S from falling. If you like the company, you'd at least be hoping this is the case so that you could potentially pick up some stock while it's not quite in favour.
Want the full picture on earnings, revenue and cash flow for the company? Then our free report on Philoptics will help you shine a light on its historical performance.Do Revenue Forecasts Match The P/S Ratio?
There's an inherent assumption that a company should be matching the industry for P/S ratios like Philoptics' to be considered reasonable.
Taking a look back first, the company's revenue growth last year wasn't something to get excited about as it posted a disappointing decline of 39%. However, a few very strong years before that means that it was still able to grow revenue by an impressive 33% in total over the last three years. So we can start by confirming that the company has generally done a very good job of growing revenue over that time, even though it had some hiccups along the way.
Comparing the recent medium-term revenue trends against the industry's one-year growth forecast of 87% shows it's noticeably less attractive.
With this information, we find it interesting that Philoptics is trading at a fairly similar P/S compared to the industry. It seems most investors are ignoring the fairly limited recent growth rates and are willing to pay up for exposure to the stock. They may be setting themselves up for future disappointment if the P/S falls to levels more in line with recent growth rates.
The Key Takeaway
With its share price dropping off a cliff, the P/S for Philoptics looks to be in line with the rest of the Semiconductor industry. While the price-to-sales ratio shouldn't be the defining factor in whether you buy a stock or not, it's quite a capable barometer of revenue expectations.
We've established that Philoptics' average P/S is a bit surprising since its recent three-year growth is lower than the wider industry forecast. When we see weak revenue with slower than industry growth, we suspect the share price is at risk of declining, bringing the P/S back in line with expectations. Unless the recent medium-term conditions improve, it's hard to accept the current share price as fair value.
There are also other vital risk factors to consider before investing and we've discovered 2 warning signs for Philoptics that you should be aware of.
It's important to make sure you look for a great company, not just the first idea you come across. So if growing profitability aligns with your idea of a great company, take a peek at this free list of interesting companies with strong recent earnings growth (and a low P/E).
New: Manage All Your Stock Portfolios in One Place
We've created the ultimate portfolio companion for stock investors, and it's free.
• Connect an unlimited number of Portfolios and see your total in one currency
• Be alerted to new Warning Signs or Risks via email or mobile
• Track the Fair Value of your stocks
Have feedback on this article? Concerned about the content? Get in touch with us directly. Alternatively, email editorial-team (at) simplywallst.com.
This article by Simply Wall St is general in nature. We provide commentary based on historical data and analyst forecasts only using an unbiased methodology and our articles are not intended to be financial advice. It does not constitute a recommendation to buy or sell any stock, and does not take account of your objectives, or your financial situation. We aim to bring you long-term focused analysis driven by fundamental data. Note that our analysis may not factor in the latest price-sensitive company announcements or qualitative material. Simply Wall St has no position in any stocks mentioned.
About KOSDAQ:A161580
Philoptics
Manufactures and sells OLED display laser processing equipment in South Korea and internationally.
Excellent balance sheet with questionable track record.
Market Insights

Advertisement
Community Narratives
Pinterest will surge as advertising innovations ignite revenue growth
Fair Value US$42.63|27.1% undervalued
BR
Community Contributor
Brambles' Revenue Set to Climb 14% with Profit Margins Following
Fair Value AU$21.90|4.9% overvalued
RO
Community Contributor
Challenging Future for STG as Organic Sales Decline by 8.8%
Fair Value DKK 116.13|26.8% undervalued
KA
Community Contributor