- South Korea
- /
- Semiconductors
- /
- KOSDAQ:A122640
YEST Co., Ltd. (KOSDAQ:122640) Shares May Have Slumped 26% But Getting In Cheap Is Still Unlikely


The YEST Co., Ltd. (KOSDAQ:122640) share price has softened a substantial 26% over the previous 30 days, handing back much of the gains the stock has made lately. The good news is that in the last year, the stock has shone bright like a diamond, gaining 108%.
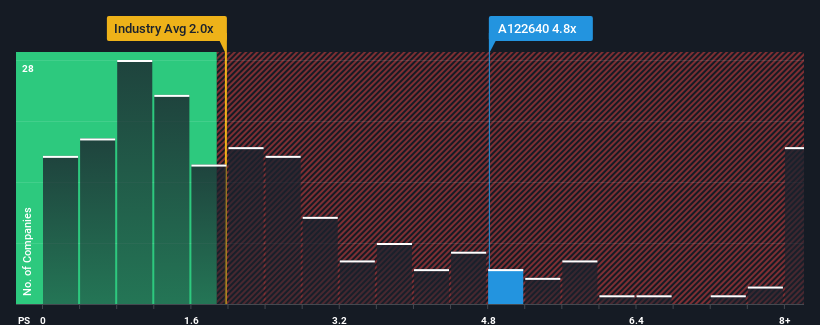
Even after such a large drop in price, when almost half of the companies in Korea's Semiconductor industry have price-to-sales ratios (or "P/S") below 2x, you may still consider YEST as a stock not worth researching with its 4.8x P/S ratio. Although, it's not wise to just take the P/S at face value as there may be an explanation why it's so lofty.
View our latest analysis for YEST
How YEST Has Been Performing
YEST has been doing a decent job lately as it's been growing revenue at a reasonable pace. Perhaps the market believes the recent revenue performance is strong enough to outperform the industry, which has inflated the P/S ratio. You'd really hope so, otherwise you're paying a pretty hefty price for no particular reason.
Want the full picture on earnings, revenue and cash flow for the company? Then our free report on YEST will help you shine a light on its historical performance.What Are Revenue Growth Metrics Telling Us About The High P/S?
In order to justify its P/S ratio, YEST would need to produce outstanding growth that's well in excess of the industry.
Taking a look back first, we see that the company managed to grow revenues by a handy 5.0% last year. Revenue has also lifted 21% in aggregate from three years ago, partly thanks to the last 12 months of growth. So we can start by confirming that the company has actually done a good job of growing revenue over that time.
This is in contrast to the rest of the industry, which is expected to grow by 95% over the next year, materially higher than the company's recent medium-term annualised growth rates.
With this in mind, we find it worrying that YEST's P/S exceeds that of its industry peers. Apparently many investors in the company are way more bullish than recent times would indicate and aren't willing to let go of their stock at any price. Only the boldest would assume these prices are sustainable as a continuation of recent revenue trends is likely to weigh heavily on the share price eventually.
What Does YEST's P/S Mean For Investors?
Even after such a strong price drop, YEST's P/S still exceeds the industry median significantly. Typically, we'd caution against reading too much into price-to-sales ratios when settling on investment decisions, though it can reveal plenty about what other market participants think about the company.
The fact that YEST currently trades on a higher P/S relative to the industry is an oddity, since its recent three-year growth is lower than the wider industry forecast. When we see slower than industry revenue growth but an elevated P/S, there's considerable risk of the share price declining, sending the P/S lower. If recent medium-term revenue trends continue, it will place shareholders' investments at significant risk and potential investors in danger of paying an excessive premium.
Don't forget that there may be other risks. For instance, we've identified 3 warning signs for YEST (1 is concerning) you should be aware of.
If strong companies turning a profit tickle your fancy, then you'll want to check out this free list of interesting companies that trade on a low P/E (but have proven they can grow earnings).
New: Manage All Your Stock Portfolios in One Place
We've created the ultimate portfolio companion for stock investors, and it's free.
• Connect an unlimited number of Portfolios and see your total in one currency
• Be alerted to new Warning Signs or Risks via email or mobile
• Track the Fair Value of your stocks
Have feedback on this article? Concerned about the content? Get in touch with us directly. Alternatively, email editorial-team (at) simplywallst.com.
This article by Simply Wall St is general in nature. We provide commentary based on historical data and analyst forecasts only using an unbiased methodology and our articles are not intended to be financial advice. It does not constitute a recommendation to buy or sell any stock, and does not take account of your objectives, or your financial situation. We aim to bring you long-term focused analysis driven by fundamental data. Note that our analysis may not factor in the latest price-sensitive company announcements or qualitative material. Simply Wall St has no position in any stocks mentioned.
About KOSDAQ:A122640
YEST
Engages in the manufacture and sale of semiconductors and display manufacturing equipment in Korea and internationally.
Flawless balance sheet and slightly overvalued.
Market Insights

Community Narratives


