- South Korea
- /
- Semiconductors
- /
- KOSDAQ:A095610
Is TES Co., Ltd's (KOSDAQ:095610) Recent Price Movement Underpinned By Its Weak Fundamentals?


With its stock down 11% over the past week, it is easy to disregard TES (KOSDAQ:095610). It is possible that the markets have ignored the company's differing financials and decided to lean-in to the negative sentiment. Fundamentals usually dictate market outcomes so it makes sense to study the company's financials. Particularly, we will be paying attention to TES' ROE today.
Return on equity or ROE is a key measure used to assess how efficiently a company's management is utilizing the company's capital. In short, ROE shows the profit each dollar generates with respect to its shareholder investments.
See our latest analysis for TES
How Do You Calculate Return On Equity?
ROE can be calculated by using the formula:
Return on Equity = Net Profit (from continuing operations) ÷ Shareholders' Equity
So, based on the above formula, the ROE for TES is:
4.6% = ₩14b ÷ ₩312b (Based on the trailing twelve months to September 2024).
The 'return' is the amount earned after tax over the last twelve months. One way to conceptualize this is that for each ₩1 of shareholders' capital it has, the company made ₩0.05 in profit.
What Has ROE Got To Do With Earnings Growth?
So far, we've learned that ROE is a measure of a company's profitability. Based on how much of its profits the company chooses to reinvest or "retain", we are then able to evaluate a company's future ability to generate profits. Generally speaking, other things being equal, firms with a high return on equity and profit retention, have a higher growth rate than firms that don’t share these attributes.
TES' Earnings Growth And 4.6% ROE
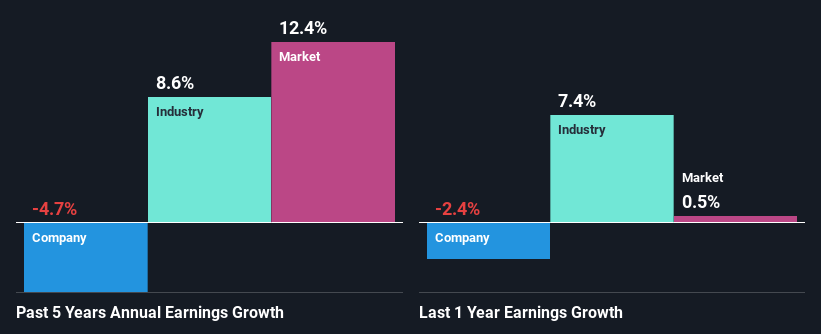
As you can see, TES' ROE looks pretty weak. Not just that, even compared to the industry average of 5.8%, the company's ROE is entirely unremarkable. For this reason, TES' five year net income decline of 4.7% is not surprising given its lower ROE. We believe that there also might be other aspects that are negatively influencing the company's earnings prospects. Such as - low earnings retention or poor allocation of capital.
That being said, we compared TES' performance with the industry and were concerned when we found that while the company has shrunk its earnings, the industry has grown its earnings at a rate of 8.6% in the same 5-year period.
The basis for attaching value to a company is, to a great extent, tied to its earnings growth. The investor should try to establish if the expected growth or decline in earnings, whichever the case may be, is priced in. By doing so, they will have an idea if the stock is headed into clear blue waters or if swampy waters await. One good indicator of expected earnings growth is the P/E ratio which determines the price the market is willing to pay for a stock based on its earnings prospects. So, you may want to check if TES is trading on a high P/E or a low P/E, relative to its industry.
Is TES Using Its Retained Earnings Effectively?
In spite of a normal three-year median payout ratio of 26% (that is, a retention ratio of 74%), the fact that TES' earnings have shrunk is quite puzzling. So there might be other factors at play here which could potentially be hampering growth. For example, the business has faced some headwinds.
Additionally, TES has paid dividends over a period of five years, which means that the company's management is rather focused on keeping up its dividend payments, regardless of the shrinking earnings. Existing analyst estimates suggest that the company's future payout ratio is expected to drop to 18% over the next three years. As a result, the expected drop in TES' payout ratio explains the anticipated rise in the company's future ROE to 12%, over the same period.
Summary
In total, we're a bit ambivalent about TES' performance. Even though it appears to be retaining most of its profits, given the low ROE, investors may not be benefitting from all that reinvestment after all. The low earnings growth suggests our theory correct. Wrapping up, we would proceed with caution with this company and one way of doing that would be to look at the risk profile of the business. To know the 3 risks we have identified for TES visit our risks dashboard for free.
Valuation is complex, but we're here to simplify it.
Discover if TES might be undervalued or overvalued with our detailed analysis, featuring fair value estimates, potential risks, dividends, insider trades, and its financial condition.
Access Free AnalysisHave feedback on this article? Concerned about the content? Get in touch with us directly. Alternatively, email editorial-team (at) simplywallst.com.
This article by Simply Wall St is general in nature. We provide commentary based on historical data and analyst forecasts only using an unbiased methodology and our articles are not intended to be financial advice. It does not constitute a recommendation to buy or sell any stock, and does not take account of your objectives, or your financial situation. We aim to bring you long-term focused analysis driven by fundamental data. Note that our analysis may not factor in the latest price-sensitive company announcements or qualitative material. Simply Wall St has no position in any stocks mentioned.
About KOSDAQ:A095610
TES
Manufactures and sells semiconductors, displays, and compound semiconductor equipment.
Excellent balance sheet low.
Market Insights

Community Narratives
