- South Korea
- /
- Specialty Stores
- /
- KOSDAQ:A309930
Is OHEIM& Company Co.,Ltd.'s (KOSDAQ:309930) Stock Price Struggling As A Result Of Its Mixed Financials?


With its stock down 39% over the past three months, it is easy to disregard OHEIM& CompanyLtd (KOSDAQ:309930). We, however decided to study the company's financials to determine if they have got anything to do with the price decline. Long-term fundamentals are usually what drive market outcomes, so it's worth paying close attention. In this article, we decided to focus on OHEIM& CompanyLtd's ROE.
Return on equity or ROE is an important factor to be considered by a shareholder because it tells them how effectively their capital is being reinvested. In short, ROE shows the profit each dollar generates with respect to its shareholder investments.
Check out our latest analysis for OHEIM& CompanyLtd
How Do You Calculate Return On Equity?
The formula for return on equity is:
Return on Equity = Net Profit (from continuing operations) ÷ Shareholders' Equity
So, based on the above formula, the ROE for OHEIM& CompanyLtd is:
9.1% = ₩2.9b ÷ ₩31b (Based on the trailing twelve months to March 2024).
The 'return' is the yearly profit. One way to conceptualize this is that for each ₩1 of shareholders' capital it has, the company made ₩0.09 in profit.
What Has ROE Got To Do With Earnings Growth?
Thus far, we have learned that ROE measures how efficiently a company is generating its profits. We now need to evaluate how much profit the company reinvests or "retains" for future growth which then gives us an idea about the growth potential of the company. Assuming everything else remains unchanged, the higher the ROE and profit retention, the higher the growth rate of a company compared to companies that don't necessarily bear these characteristics.
OHEIM& CompanyLtd's Earnings Growth And 9.1% ROE
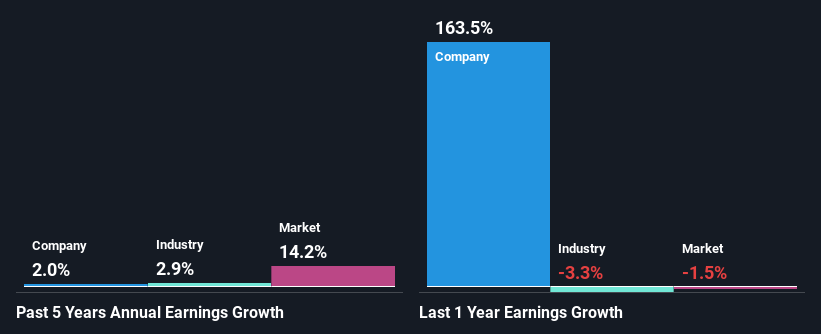
At first glance, OHEIM& CompanyLtd's ROE doesn't look very promising. Yet, a closer study shows that the company's ROE is similar to the industry average of 9.1%. However, OHEIM& CompanyLtd has seen a flattish net income growth over the past five years, which is not saying much. Bear in mind, the company's ROE is not very high. So that could also be one of the reasons behind the company's flat growth in earnings.
We then compared OHEIM& CompanyLtd's net income growth with the industry and found that the company's growth figure is lower than the average industry growth rate of 2.9% in the same 5-year period, which is a bit concerning.
The basis for attaching value to a company is, to a great extent, tied to its earnings growth. It’s important for an investor to know whether the market has priced in the company's expected earnings growth (or decline). This then helps them determine if the stock is placed for a bright or bleak future. If you're wondering about OHEIM& CompanyLtd's's valuation, check out this gauge of its price-to-earnings ratio, as compared to its industry.
Is OHEIM& CompanyLtd Efficiently Re-investing Its Profits?
OHEIM& CompanyLtd doesn't pay any regular dividends, which means that it is retaining all of its earnings. This makes us question why the company is retaining so much of its profits and still generating almost no growth? It looks like there might be some other reasons to explain the lack in that respect. For example, the business could be in decline.
Summary
On the whole, we feel that the performance shown by OHEIM& CompanyLtd can be open to many interpretations. While the company does have a high rate of reinvestment, the low ROE means that all that reinvestment is not reaping any benefit to its investors, and moreover, its having a negative impact on the earnings growth. So far, we've only made a quick discussion around the company's earnings growth. You can do your own research on OHEIM& CompanyLtd and see how it has performed in the past by looking at this FREE detailed graph of past earnings, revenue and cash flows.
New: AI Stock Screener & Alerts
Our new AI Stock Screener scans the market every day to uncover opportunities.
• Dividend Powerhouses (3%+ Yield)
• Undervalued Small Caps with Insider Buying
• High growth Tech and AI Companies
Or build your own from over 50 metrics.
Have feedback on this article? Concerned about the content? Get in touch with us directly. Alternatively, email editorial-team (at) simplywallst.com.
This article by Simply Wall St is general in nature. We provide commentary based on historical data and analyst forecasts only using an unbiased methodology and our articles are not intended to be financial advice. It does not constitute a recommendation to buy or sell any stock, and does not take account of your objectives, or your financial situation. We aim to bring you long-term focused analysis driven by fundamental data. Note that our analysis may not factor in the latest price-sensitive company announcements or qualitative material. Simply Wall St has no position in any stocks mentioned.
Have feedback on this article? Concerned about the content? Get in touch with us directly. Alternatively, email editorial-team@simplywallst.com
About KOSDAQ:A309930
Proven track record with adequate balance sheet.

