- South Korea
- /
- Pharma
- /
- KOSE:A000520
There's Reason For Concern Over Samil Pharmaceutical Co.,Ltd's (KRX:000520) Massive 29% Price Jump


Samil Pharmaceutical Co.,Ltd (KRX:000520) shares have continued their recent momentum with a 29% gain in the last month alone. The last 30 days bring the annual gain to a very sharp 65%.
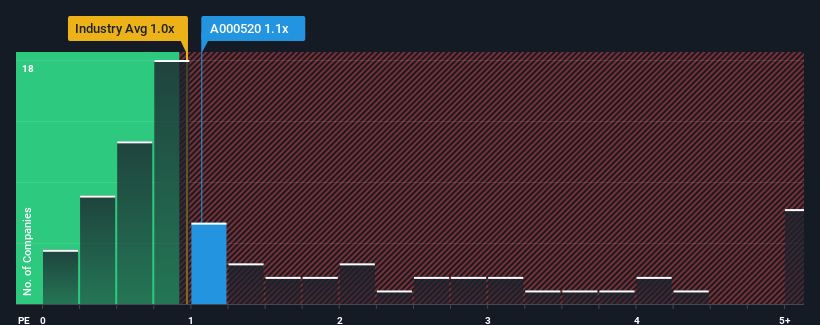
Even after such a large jump in price, you could still be forgiven for feeling indifferent about Samil PharmaceuticalLtd's P/S ratio of 1.1x, since the median price-to-sales (or "P/S") ratio for the Pharmaceuticals industry in Korea is also close to 1x. However, investors might be overlooking a clear opportunity or potential setback if there is no rational basis for the P/S.
See our latest analysis for Samil PharmaceuticalLtd
How Samil PharmaceuticalLtd Has Been Performing
Revenue has risen firmly for Samil PharmaceuticalLtd recently, which is pleasing to see. It might be that many expect the respectable revenue performance to wane, which has kept the P/S from rising. If you like the company, you'd be hoping this isn't the case so that you could potentially pick up some stock while it's not quite in favour.
Although there are no analyst estimates available for Samil PharmaceuticalLtd, take a look at this free data-rich visualisation to see how the company stacks up on earnings, revenue and cash flow.Is There Some Revenue Growth Forecasted For Samil PharmaceuticalLtd?
There's an inherent assumption that a company should be matching the industry for P/S ratios like Samil PharmaceuticalLtd's to be considered reasonable.
Taking a look back first, we see that the company managed to grow revenues by a handy 9.3% last year. Pleasingly, revenue has also lifted 60% in aggregate from three years ago, partly thanks to the last 12 months of growth. Therefore, it's fair to say the revenue growth recently has been superb for the company.
Comparing that to the industry, which is predicted to deliver 40% growth in the next 12 months, the company's momentum is weaker, based on recent medium-term annualised revenue results.
With this information, we find it interesting that Samil PharmaceuticalLtd is trading at a fairly similar P/S compared to the industry. Apparently many investors in the company are less bearish than recent times would indicate and aren't willing to let go of their stock right now. Maintaining these prices will be difficult to achieve as a continuation of recent revenue trends is likely to weigh down the shares eventually.
What Does Samil PharmaceuticalLtd's P/S Mean For Investors?
Samil PharmaceuticalLtd's stock has a lot of momentum behind it lately, which has brought its P/S level with the rest of the industry. Generally, our preference is to limit the use of the price-to-sales ratio to establishing what the market thinks about the overall health of a company.
We've established that Samil PharmaceuticalLtd's average P/S is a bit surprising since its recent three-year growth is lower than the wider industry forecast. When we see weak revenue with slower than industry growth, we suspect the share price is at risk of declining, bringing the P/S back in line with expectations. Unless the recent medium-term conditions improve, it's hard to accept the current share price as fair value.
It is also worth noting that we have found 4 warning signs for Samil PharmaceuticalLtd (1 is potentially serious!) that you need to take into consideration.
It's important to make sure you look for a great company, not just the first idea you come across. So if growing profitability aligns with your idea of a great company, take a peek at this free list of interesting companies with strong recent earnings growth (and a low P/E).
New: Manage All Your Stock Portfolios in One Place
We've created the ultimate portfolio companion for stock investors, and it's free.
• Connect an unlimited number of Portfolios and see your total in one currency
• Be alerted to new Warning Signs or Risks via email or mobile
• Track the Fair Value of your stocks
Have feedback on this article? Concerned about the content? Get in touch with us directly. Alternatively, email editorial-team (at) simplywallst.com.
This article by Simply Wall St is general in nature. We provide commentary based on historical data and analyst forecasts only using an unbiased methodology and our articles are not intended to be financial advice. It does not constitute a recommendation to buy or sell any stock, and does not take account of your objectives, or your financial situation. We aim to bring you long-term focused analysis driven by fundamental data. Note that our analysis may not factor in the latest price-sensitive company announcements or qualitative material. Simply Wall St has no position in any stocks mentioned.
About KOSE:A000520
Samil PharmaceuticalLtd
Engages in the manufacture and sale of indispensable medicines in South Korea.
Mediocre balance sheet low.
Market Insights

Community Narratives

