
Advertisement

We can readily understand why investors are attracted to unprofitable companies. For example, although Amazon.com made losses for many years after listing, if you had bought and held the shares since 1999, you would have made a fortune. But while history lauds those rare successes, those that fail are often forgotten; who remembers Pets.com?
Given this risk, we thought we'd take a look at whether Shaperon (KOSDAQ:378800) shareholders should be worried about its cash burn. In this report, we will consider the company's annual negative free cash flow, henceforth referring to it as the 'cash burn'. Let's start with an examination of the business' cash, relative to its cash burn.
Check out our latest analysis for Shaperon
How Long Is Shaperon's Cash Runway?
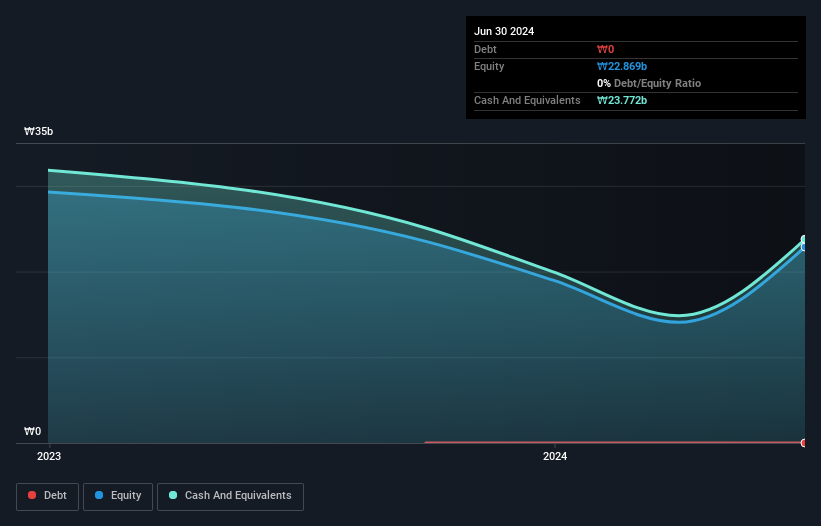
You can calculate a company's cash runway by dividing the amount of cash it has by the rate at which it is spending that cash. When Shaperon last reported its June 2024 balance sheet in August 2024, it had zero debt and cash worth ₩24b. Importantly, its cash burn was ₩16b over the trailing twelve months. Therefore, from June 2024 it had roughly 18 months of cash runway. That's not too bad, but it's fair to say the end of the cash runway is in sight, unless cash burn reduces drastically. The image below shows how its cash balance has been changing over the last few years.
How Is Shaperon's Cash Burn Changing Over Time?
In our view, Shaperon doesn't yet produce significant amounts of operating revenue, since it reported just ₩91m in the last twelve months. Therefore, for the purposes of this analysis we'll focus on how the cash burn is tracking. During the last twelve months, its cash burn actually ramped up 58%. Oftentimes, increased cash burn simply means a company is accelerating its business development, but one should always be mindful that this causes the cash runway to shrink. Admittedly, we're a bit cautious of Shaperon due to its lack of significant operating revenues. So we'd generally prefer stocks from this list of stocks that have analysts forecasting growth.
How Hard Would It Be For Shaperon To Raise More Cash For Growth?
Given its cash burn trajectory, Shaperon shareholders may wish to consider how easily it could raise more cash, despite its solid cash runway. Companies can raise capital through either debt or equity. One of the main advantages held by publicly listed companies is that they can sell shares to investors to raise cash and fund growth. By comparing a company's annual cash burn to its total market capitalisation, we can estimate roughly how many shares it would have to issue in order to run the company for another year (at the same burn rate).
Shaperon has a market capitalisation of ₩68b and burnt through ₩16b last year, which is 24% of the company's market value. That's fairly notable cash burn, so if the company had to sell shares to cover the cost of another year's operations, shareholders would suffer some costly dilution.
How Risky Is Shaperon's Cash Burn Situation?
Even though its increasing cash burn makes us a little nervous, we are compelled to mention that we thought Shaperon's cash runway was relatively promising. We don't think its cash burn is particularly problematic, but after considering the range of factors in this article, we do think shareholders should be monitoring how it changes over time. Taking a deeper dive, we've spotted 6 warning signs for Shaperon you should be aware of, and 3 of them are significant.
Of course, you might find a fantastic investment by looking elsewhere. So take a peek at this free list of interesting companies, and this list of stocks growth stocks (according to analyst forecasts)
New: Manage All Your Stock Portfolios in One Place
We've created the ultimate portfolio companion for stock investors, and it's free.
• Connect an unlimited number of Portfolios and see your total in one currency
• Be alerted to new Warning Signs or Risks via email or mobile
• Track the Fair Value of your stocks
Have feedback on this article? Concerned about the content? Get in touch with us directly. Alternatively, email editorial-team (at) simplywallst.com.
This article by Simply Wall St is general in nature. We provide commentary based on historical data and analyst forecasts only using an unbiased methodology and our articles are not intended to be financial advice. It does not constitute a recommendation to buy or sell any stock, and does not take account of your objectives, or your financial situation. We aim to bring you long-term focused analysis driven by fundamental data. Note that our analysis may not factor in the latest price-sensitive company announcements or qualitative material. Simply Wall St has no position in any stocks mentioned.
About KOSDAQ:A378800
Shaperon
A clinical stage biotech company, develops novel inflammasome inhibitors targeting immune-mediated inflammatory disorders with high unmet medical needs and nanobody therapeutics.
Moderate with adequate balance sheet.
Market Insights

Advertisement
Community Narratives
The Most Undervalued of the Magnificent 7
Fair Value US$237.43|35.4% undervalued
IN
Community Contributor
PVA TePla's New Strategy Aims for 22% Revenue Growth in Semiconductor Recovery
Fair Value €19.19|20.8% undervalued
MI
Community Contributor