
Advertisement
- South Korea
- /
- Biotech
- /
- KOSDAQ:A352770
Benign Growth For Clinomics Inc. (KOSDAQ:352770) Underpins Stock's 33% Plummet

Unfortunately for some shareholders, the Clinomics Inc. (KOSDAQ:352770) share price has dived 33% in the last thirty days, prolonging recent pain. For any long-term shareholders, the last month ends a year to forget by locking in a 70% share price decline.
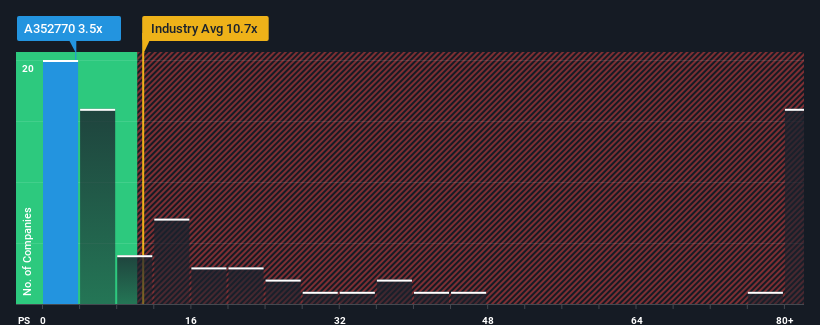
After such a large drop in price, Clinomics' price-to-sales (or "P/S") ratio of 3.5x might make it look like a strong buy right now compared to the wider Biotechs industry in Korea, where around half of the companies have P/S ratios above 10.7x and even P/S above 40x are quite common. Nonetheless, we'd need to dig a little deeper to determine if there is a rational basis for the highly reduced P/S.
View our latest analysis for Clinomics
How Has Clinomics Performed Recently?
As an illustration, revenue has deteriorated at Clinomics over the last year, which is not ideal at all. One possibility is that the P/S is low because investors think the company won't do enough to avoid underperforming the broader industry in the near future. If you like the company, you'd be hoping this isn't the case so that you could potentially pick up some stock while it's out of favour.
Although there are no analyst estimates available for Clinomics, take a look at this free data-rich visualisation to see how the company stacks up on earnings, revenue and cash flow.How Is Clinomics' Revenue Growth Trending?
There's an inherent assumption that a company should far underperform the industry for P/S ratios like Clinomics' to be considered reasonable.
Retrospectively, the last year delivered a frustrating 68% decrease to the company's top line. Still, the latest three year period has seen an excellent 59% overall rise in revenue, in spite of its unsatisfying short-term performance. So we can start by confirming that the company has generally done a very good job of growing revenue over that time, even though it had some hiccups along the way.
Comparing that to the industry, which is predicted to deliver 37% growth in the next 12 months, the company's momentum is weaker, based on recent medium-term annualised revenue results.
With this information, we can see why Clinomics is trading at a P/S lower than the industry. It seems most investors are expecting to see the recent limited growth rates continue into the future and are only willing to pay a reduced amount for the stock.
What We Can Learn From Clinomics' P/S?
Clinomics' P/S looks about as weak as its stock price lately. While the price-to-sales ratio shouldn't be the defining factor in whether you buy a stock or not, it's quite a capable barometer of revenue expectations.
In line with expectations, Clinomics maintains its low P/S on the weakness of its recent three-year growth being lower than the wider industry forecast. At this stage investors feel the potential for an improvement in revenue isn't great enough to justify a higher P/S ratio. If recent medium-term revenue trends continue, it's hard to see the share price experience a reversal of fortunes anytime soon.
Before you settle on your opinion, we've discovered 4 warning signs for Clinomics (2 are a bit concerning!) that you should be aware of.
It's important to make sure you look for a great company, not just the first idea you come across. So if growing profitability aligns with your idea of a great company, take a peek at this free list of interesting companies with strong recent earnings growth (and a low P/E).
New: AI Stock Screener & Alerts
Our new AI Stock Screener scans the market every day to uncover opportunities.
• Dividend Powerhouses (3%+ Yield)
• Undervalued Small Caps with Insider Buying
• High growth Tech and AI Companies
Or build your own from over 50 metrics.
Have feedback on this article? Concerned about the content? Get in touch with us directly. Alternatively, email editorial-team (at) simplywallst.com.
This article by Simply Wall St is general in nature. We provide commentary based on historical data and analyst forecasts only using an unbiased methodology and our articles are not intended to be financial advice. It does not constitute a recommendation to buy or sell any stock, and does not take account of your objectives, or your financial situation. We aim to bring you long-term focused analysis driven by fundamental data. Note that our analysis may not factor in the latest price-sensitive company announcements or qualitative material. Simply Wall St has no position in any stocks mentioned.
About KOSDAQ:A352770
Celestra
A biotechnology company, provides genome-based cancer and disease diagnostic solutions.
Mediocre balance sheet low.
Market Insights

Advertisement
Community Narratives
Pinterest will surge as advertising innovations ignite revenue growth
Fair Value US$42.63|27.0% undervalued
BR
Community Contributor
Brambles' Revenue Set to Climb 14% with Profit Margins Following
Fair Value AU$21.90|5.9% overvalued
RO
Community Contributor
Challenging Future for STG as Organic Sales Decline by 8.8%
Fair Value DKK 116.13|26.8% undervalued
KA
Community Contributor