
Advertisement

David Iben put it well when he said, 'Volatility is not a risk we care about. What we care about is avoiding the permanent loss of capital.' It's only natural to consider a company's balance sheet when you examine how risky it is, since debt is often involved when a business collapses. We note that High Tech Pharm Co., Ltd. (KOSDAQ:106190) does have debt on its balance sheet. But should shareholders be worried about its use of debt?
What Risk Does Debt Bring?
Debt assists a business until the business has trouble paying it off, either with new capital or with free cash flow. In the worst case scenario, a company can go bankrupt if it cannot pay its creditors. However, a more usual (but still expensive) situation is where a company must dilute shareholders at a cheap share price simply to get debt under control. Having said that, the most common situation is where a company manages its debt reasonably well - and to its own advantage. The first thing to do when considering how much debt a business uses is to look at its cash and debt together.
View our latest analysis for High Tech Pharm
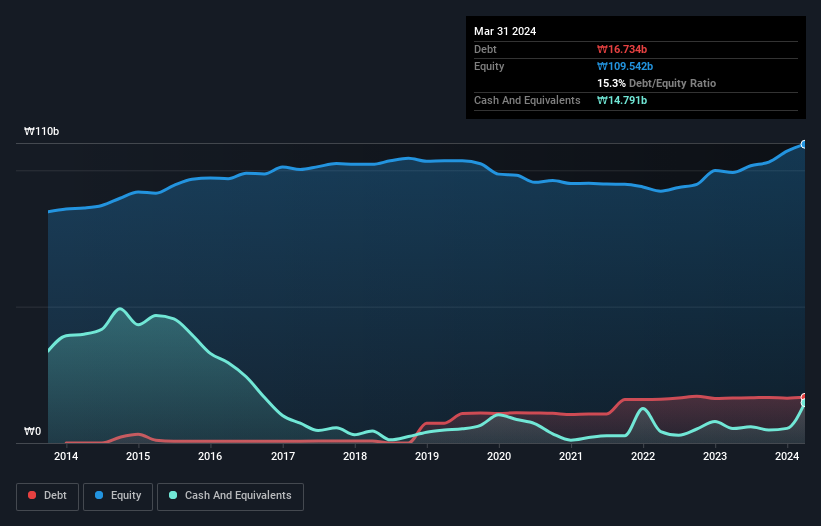
What Is High Tech Pharm's Net Debt?
The chart below, which you can click on for greater detail, shows that High Tech Pharm had ₩16.7b in debt in March 2024; about the same as the year before. On the flip side, it has ₩14.8b in cash leading to net debt of about ₩1.94b.
How Healthy Is High Tech Pharm's Balance Sheet?
We can see from the most recent balance sheet that High Tech Pharm had liabilities of ₩32.2b falling due within a year, and liabilities of ₩5.30b due beyond that. Offsetting this, it had ₩14.8b in cash and ₩17.9b in receivables that were due within 12 months. So its liabilities outweigh the sum of its cash and (near-term) receivables by ₩4.86b.
Given High Tech Pharm has a market capitalization of ₩173.3b, it's hard to believe these liabilities pose much threat. Having said that, it's clear that we should continue to monitor its balance sheet, lest it change for the worse. Carrying virtually no net debt, High Tech Pharm has a very light debt load indeed.
We use two main ratios to inform us about debt levels relative to earnings. The first is net debt divided by earnings before interest, tax, depreciation, and amortization (EBITDA), while the second is how many times its earnings before interest and tax (EBIT) covers its interest expense (or its interest cover, for short). This way, we consider both the absolute quantum of the debt, as well as the interest rates paid on it.
High Tech Pharm's net debt is only 0.10 times its EBITDA. And its EBIT easily covers its interest expense, being 16.4 times the size. So you could argue it is no more threatened by its debt than an elephant is by a mouse. Even more impressive was the fact that High Tech Pharm grew its EBIT by 151% over twelve months. That boost will make it even easier to pay down debt going forward. There's no doubt that we learn most about debt from the balance sheet. But you can't view debt in total isolation; since High Tech Pharm will need earnings to service that debt. So when considering debt, it's definitely worth looking at the earnings trend. Click here for an interactive snapshot.
But our final consideration is also important, because a company cannot pay debt with paper profits; it needs cold hard cash. So we always check how much of that EBIT is translated into free cash flow. Over the most recent two years, High Tech Pharm recorded free cash flow worth 57% of its EBIT, which is around normal, given free cash flow excludes interest and tax. This cold hard cash means it can reduce its debt when it wants to.
Our View
High Tech Pharm's interest cover suggests it can handle its debt as easily as Cristiano Ronaldo could score a goal against an under 14's goalkeeper. And the good news does not stop there, as its EBIT growth rate also supports that impression! Considering this range of factors, it seems to us that High Tech Pharm is quite prudent with its debt, and the risks seem well managed. So the balance sheet looks pretty healthy, to us. Over time, share prices tend to follow earnings per share, so if you're interested in High Tech Pharm, you may well want to click here to check an interactive graph of its earnings per share history.
When all is said and done, sometimes its easier to focus on companies that don't even need debt. Readers can access a list of growth stocks with zero net debt 100% free, right now.
Valuation is complex, but we're here to simplify it.
Discover if High Tech Pharm might be undervalued or overvalued with our detailed analysis, featuring fair value estimates, potential risks, dividends, insider trades, and its financial condition.
Access Free AnalysisHave feedback on this article? Concerned about the content? Get in touch with us directly. Alternatively, email editorial-team (at) simplywallst.com.
This article by Simply Wall St is general in nature. We provide commentary based on historical data and analyst forecasts only using an unbiased methodology and our articles are not intended to be financial advice. It does not constitute a recommendation to buy or sell any stock, and does not take account of your objectives, or your financial situation. We aim to bring you long-term focused analysis driven by fundamental data. Note that our analysis may not factor in the latest price-sensitive company announcements or qualitative material. Simply Wall St has no position in any stocks mentioned.
Have feedback on this article? Concerned about the content? Get in touch with us directly. Alternatively, email editorial-team@simplywallst.com
About KOSDAQ:A106190
High Tech Pharm
Researches and develops, manufactures, and sells injectable carbapenem-based antibiotics worldwide.
Flawless balance sheet and good value.
Market Insights

Advertisement
Community Narratives
The Most Undervalued of the Magnificent 7
Fair Value US$237.43|35.4% undervalued
IN
Community Contributor
PVA TePla's New Strategy Aims for 22% Revenue Growth in Semiconductor Recovery
Fair Value €19.19|20.3% undervalued
MI
Community Contributor