- South Korea
- /
- Life Sciences
- /
- KOSDAQ:A087010
Peptron's (KOSDAQ:087010) Stock Price Has Reduced 53% In The Past Five Years

Generally speaking long term investing is the way to go. But along the way some stocks are going to perform badly. Zooming in on an example, the Peptron, Inc. (KOSDAQ:087010) share price dropped 53% in the last half decade. We certainly feel for shareholders who bought near the top. Furthermore, it's down 20% in about a quarter. That's not much fun for holders.
View our latest analysis for Peptron
Peptron wasn't profitable in the last twelve months, it is unlikely we'll see a strong correlation between its share price and its earnings per share (EPS). Arguably revenue is our next best option. Generally speaking, companies without profits are expected to grow revenue every year, and at a good clip. As you can imagine, fast revenue growth, when maintained, often leads to fast profit growth.
Over half a decade Peptron reduced its trailing twelve month revenue by 2.9% for each year. While far from catastrophic that is not good. The share price decline of 9% compound, over five years, is understandable given the company is losing money, and revenue is moving in the wrong direction. The chance of imminent investor enthusiasm for this stock seems slimmer than Louise Brooks. Ultimately, it may be worth watching - should revenue pick up, the share price might follow.
You can see below how earnings and revenue have changed over time (discover the exact values by clicking on the image).
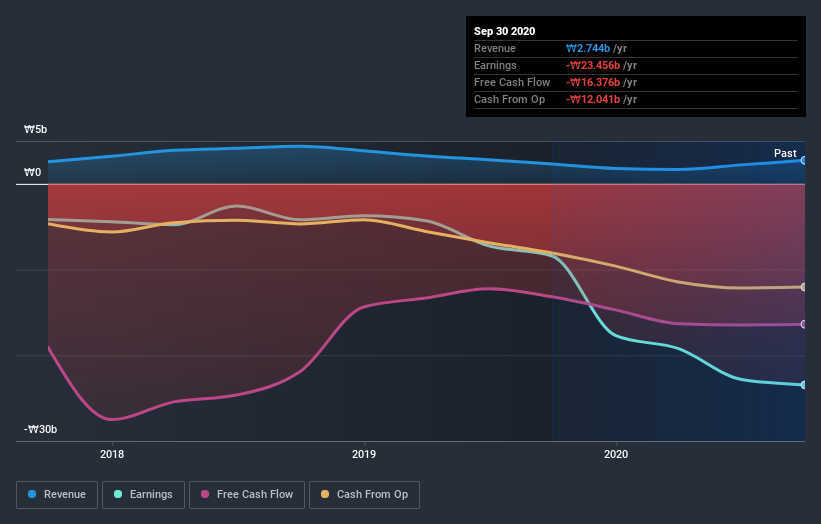
Take a more thorough look at Peptron's financial health with this free report on its balance sheet.
What about the Total Shareholder Return (TSR)?
We'd be remiss not to mention the difference between Peptron's total shareholder return (TSR) and its share price return. Arguably the TSR is a more complete return calculation because it accounts for the value of dividends (as if they were reinvested), along with the hypothetical value of any discounted capital that have been offered to shareholders. We note that Peptron's TSR, at -51% is higher than its share price return of -53%. When you consider it hasn't been paying a dividend, this data suggests shareholders have benefitted from a spin-off, or had the opportunity to acquire attractively priced shares in a discounted capital raising.
A Different Perspective
Investors in Peptron had a tough year, with a total loss of 13%, against a market gain of about 34%. Even the share prices of good stocks drop sometimes, but we want to see improvements in the fundamental metrics of a business, before getting too interested. However, the loss over the last year isn't as bad as the 9% per annum loss investors have suffered over the last half decade. We'd need to see some sustained improvements in the key metrics before we could muster much enthusiasm. I find it very interesting to look at share price over the long term as a proxy for business performance. But to truly gain insight, we need to consider other information, too. Consider for instance, the ever-present spectre of investment risk. We've identified 4 warning signs with Peptron (at least 2 which shouldn't be ignored) , and understanding them should be part of your investment process.
If you would prefer to check out another company -- one with potentially superior financials -- then do not miss this free list of companies that have proven they can grow earnings.
Please note, the market returns quoted in this article reflect the market weighted average returns of stocks that currently trade on KR exchanges.
When trading Peptron or any other investment, use the platform considered by many to be the Professional's Gateway to the Worlds Market, Interactive Brokers. You get the lowest-cost* trading on stocks, options, futures, forex, bonds and funds worldwide from a single integrated account. Promoted
New: Manage All Your Stock Portfolios in One Place
We've created the ultimate portfolio companion for stock investors, and it's free.
• Connect an unlimited number of Portfolios and see your total in one currency
• Be alerted to new Warning Signs or Risks via email or mobile
• Track the Fair Value of your stocks
This article by Simply Wall St is general in nature. It does not constitute a recommendation to buy or sell any stock, and does not take account of your objectives, or your financial situation. We aim to bring you long-term focused analysis driven by fundamental data. Note that our analysis may not factor in the latest price-sensitive company announcements or qualitative material. Simply Wall St has no position in any stocks mentioned.
*Interactive Brokers Rated Lowest Cost Broker by StockBrokers.com Annual Online Review 2020
Have feedback on this article? Concerned about the content? Get in touch with us directly. Alternatively, email editorial-team (at) simplywallst.com.
About KOSDAQ:A087010
Adequate balance sheet low.
Similar Companies
Market Insights

Community Narratives

