
Advertisement
- South Korea
- /
- Pharma
- /
- KOSDAQ:A067290
We Think You Should Be Aware Of Some Concerning Factors In JW Shinyak's (KOSDAQ:067290) Earnings
JW Shinyak Corporation's (KOSDAQ:067290 ) stock didn't jump after it announced some healthy earnings. Our analysis showed that there are some concerning factors in the earnings that investors may be cautious of.
A Closer Look At JW Shinyak's Earnings
In high finance, the key ratio used to measure how well a company converts reported profits into free cash flow (FCF) is the accrual ratio (from cashflow). To get the accrual ratio we first subtract FCF from profit for a period, and then divide that number by the average operating assets for the period. This ratio tells us how much of a company's profit is not backed by free cashflow.
That means a negative accrual ratio is a good thing, because it shows that the company is bringing in more free cash flow than its profit would suggest. While it's not a problem to have a positive accrual ratio, indicating a certain level of non-cash profits, a high accrual ratio is arguably a bad thing, because it indicates paper profits are not matched by cash flow. To quote a 2014 paper by Lewellen and Resutek, "firms with higher accruals tend to be less profitable in the future".
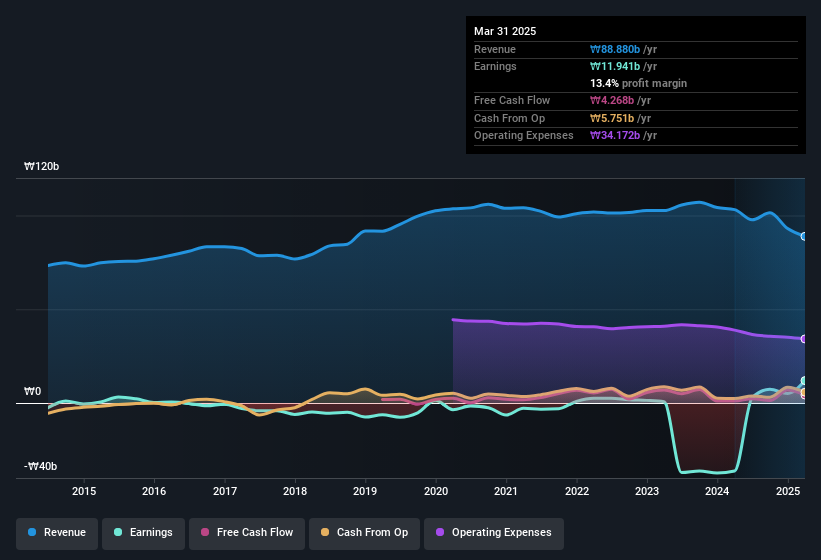
For the year to March 2025, JW Shinyak had an accrual ratio of 0.23. We can therefore deduce that its free cash flow fell well short of covering its statutory profit. In fact, it had free cash flow of ₩4.3b in the last year, which was a lot less than its statutory profit of ₩11.9b. At this point we should mention that JW Shinyak did manage to increase its free cash flow in the last twelve months The good news for shareholders is that JW Shinyak's accrual ratio was much better last year, so this year's poor reading might simply be a case of a short term mismatch between profit and FCF. As a result, some shareholders may be looking for stronger cash conversion in the current year.
Note: we always recommend investors check balance sheet strength. Click here to be taken to our balance sheet analysis of JW Shinyak.
Our Take On JW Shinyak's Profit Performance
JW Shinyak's accrual ratio for the last twelve months signifies cash conversion is less than ideal, which is a negative when it comes to our view of its earnings. Because of this, we think that it may be that JW Shinyak's statutory profits are better than its underlying earnings power. The good news is that it earned a profit in the last twelve months, despite its previous loss. The goal of this article has been to assess how well we can rely on the statutory earnings to reflect the company's potential, but there is plenty more to consider. If you'd like to know more about JW Shinyak as a business, it's important to be aware of any risks it's facing. Every company has risks, and we've spotted 2 warning signs for JW Shinyak (of which 1 makes us a bit uncomfortable!) you should know about.
Today we've zoomed in on a single data point to better understand the nature of JW Shinyak's profit. But there is always more to discover if you are capable of focussing your mind on minutiae. Some people consider a high return on equity to be a good sign of a quality business. While it might take a little research on your behalf, you may find this free collection of companies boasting high return on equity, or this list of stocks with significant insider holdings to be useful.
New: Manage All Your Stock Portfolios in One Place
We've created the ultimate portfolio companion for stock investors, and it's free.
• Connect an unlimited number of Portfolios and see your total in one currency
• Be alerted to new Warning Signs or Risks via email or mobile
• Track the Fair Value of your stocks
Have feedback on this article? Concerned about the content? Get in touch with us directly. Alternatively, email editorial-team (at) simplywallst.com.
This article by Simply Wall St is general in nature. We provide commentary based on historical data and analyst forecasts only using an unbiased methodology and our articles are not intended to be financial advice. It does not constitute a recommendation to buy or sell any stock, and does not take account of your objectives, or your financial situation. We aim to bring you long-term focused analysis driven by fundamental data. Note that our analysis may not factor in the latest price-sensitive company announcements or qualitative material. Simply Wall St has no position in any stocks mentioned.
About KOSDAQ:A067290
JW Shinyak
Engages in the research, development, production, and sale of medicines and medical supplies in South Korea.
Flawless balance sheet with solid track record.
Market Insights

Advertisement
Community Narratives
A formidable player in AI and enterprise computing.
Fair Value US$210.00|12.2% overvalued
CO
Community Contributor
IREN's Bold Moves in Sustainable Bitcoin Mining & AI Data Centers
Fair Value US$72.52|17.1% undervalued
BL
Community Contributor
Cooling the Champions: The Aussie Tech Behind F1's Victories
Fair Value AU$12.40|38.7% undervalued
TR
Community Contributor