
Advertisement
- South Korea
- /
- Pharma
- /
- KOSDAQ:A066700
Estimating The Fair Value Of Theragen Etex Co.,Ltd. (KOSDAQ:066700)

Key Insights
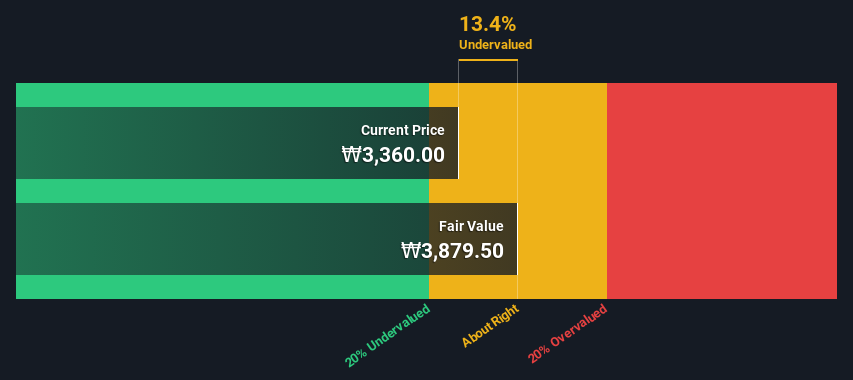
- Theragen EtexLtd's estimated fair value is ₩3,880 based on 2 Stage Free Cash Flow to Equity
- Current share price of ₩3,360 suggests Theragen EtexLtd is potentially trading close to its fair value
- Peers of Theragen EtexLtd are currently trading on average at a 56% premium
In this article we are going to estimate the intrinsic value of Theragen Etex Co.,Ltd. (KOSDAQ:066700) by taking the expected future cash flows and discounting them to today's value. We will take advantage of the Discounted Cash Flow (DCF) model for this purpose. It may sound complicated, but actually it is quite simple!
Remember though, that there are many ways to estimate a company's value, and a DCF is just one method. Anyone interested in learning a bit more about intrinsic value should have a read of the Simply Wall St analysis model.
See our latest analysis for Theragen EtexLtd
Step By Step Through The Calculation
We are going to use a two-stage DCF model, which, as the name states, takes into account two stages of growth. The first stage is generally a higher growth period which levels off heading towards the terminal value, captured in the second 'steady growth' period. In the first stage we need to estimate the cash flows to the business over the next ten years. Seeing as no analyst estimates of free cash flow are available to us, we have extrapolate the previous free cash flow (FCF) from the company's last reported value. We assume companies with shrinking free cash flow will slow their rate of shrinkage, and that companies with growing free cash flow will see their growth rate slow, over this period. We do this to reflect that growth tends to slow more in the early years than it does in later years.
A DCF is all about the idea that a dollar in the future is less valuable than a dollar today, and so the sum of these future cash flows is then discounted to today's value:
10-year free cash flow (FCF) forecast
| 2025 | 2026 | 2027 | 2028 | 2029 | 2030 | 2031 | 2032 | 2033 | 2034 | |
| Levered FCF (₩, Millions) | ₩5.64b | ₩5.42b | ₩5.31b | ₩5.28b | ₩5.30b | ₩5.35b | ₩5.43b | ₩5.53b | ₩5.64b | ₩5.76b |
| Growth Rate Estimate Source | Est @ -6.70% | Est @ -3.92% | Est @ -1.98% | Est @ -0.62% | Est @ 0.34% | Est @ 1.00% | Est @ 1.47% | Est @ 1.80% | Est @ 2.03% | Est @ 2.19% |
| Present Value (₩, Millions) Discounted @ 6.3% | ₩5.3k | ₩4.8k | ₩4.4k | ₩4.1k | ₩3.9k | ₩3.7k | ₩3.5k | ₩3.4k | ₩3.2k | ₩3.1k |
("Est" = FCF growth rate estimated by Simply Wall St)
Present Value of 10-year Cash Flow (PVCF) = ₩40b
We now need to calculate the Terminal Value, which accounts for all the future cash flows after this ten year period. The Gordon Growth formula is used to calculate Terminal Value at a future annual growth rate equal to the 5-year average of the 10-year government bond yield of 2.6%. We discount the terminal cash flows to today's value at a cost of equity of 6.3%.
Terminal Value (TV)= FCF2034 × (1 + g) ÷ (r – g) = ₩5.8b× (1 + 2.6%) ÷ (6.3%– 2.6%) = ₩156b
Present Value of Terminal Value (PVTV)= TV / (1 + r)10= ₩156b÷ ( 1 + 6.3%)10= ₩85b
The total value is the sum of cash flows for the next ten years plus the discounted terminal value, which results in the Total Equity Value, which in this case is ₩124b. To get the intrinsic value per share, we divide this by the total number of shares outstanding. Compared to the current share price of ₩3.4k, the company appears about fair value at a 13% discount to where the stock price trades currently. Remember though, that this is just an approximate valuation, and like any complex formula - garbage in, garbage out.
Important Assumptions
The calculation above is very dependent on two assumptions. The first is the discount rate and the other is the cash flows. If you don't agree with these result, have a go at the calculation yourself and play with the assumptions. The DCF also does not consider the possible cyclicality of an industry, or a company's future capital requirements, so it does not give a full picture of a company's potential performance. Given that we are looking at Theragen EtexLtd as potential shareholders, the cost of equity is used as the discount rate, rather than the cost of capital (or weighted average cost of capital, WACC) which accounts for debt. In this calculation we've used 6.3%, which is based on a levered beta of 0.800. Beta is a measure of a stock's volatility, compared to the market as a whole. We get our beta from the industry average beta of globally comparable companies, with an imposed limit between 0.8 and 2.0, which is a reasonable range for a stable business.
Next Steps:
Valuation is only one side of the coin in terms of building your investment thesis, and it shouldn't be the only metric you look at when researching a company. DCF models are not the be-all and end-all of investment valuation. Instead the best use for a DCF model is to test certain assumptions and theories to see if they would lead to the company being undervalued or overvalued. If a company grows at a different rate, or if its cost of equity or risk free rate changes sharply, the output can look very different. For Theragen EtexLtd, there are three relevant items you should assess:
- Risks: Be aware that Theragen EtexLtd is showing 2 warning signs in our investment analysis , you should know about...
- Other Solid Businesses: Low debt, high returns on equity and good past performance are fundamental to a strong business. Why not explore our interactive list of stocks with solid business fundamentals to see if there are other companies you may not have considered!
- Other Environmentally-Friendly Companies: Concerned about the environment and think consumers will buy eco-friendly products more and more? Browse through our interactive list of companies that are thinking about a greener future to discover some stocks you may not have thought of!
PS. The Simply Wall St app conducts a discounted cash flow valuation for every stock on the KOSDAQ every day. If you want to find the calculation for other stocks just search here.
Valuation is complex, but we're here to simplify it.
Discover if Theragen EtexLtd might be undervalued or overvalued with our detailed analysis, featuring fair value estimates, potential risks, dividends, insider trades, and its financial condition.
Access Free AnalysisHave feedback on this article? Concerned about the content? Get in touch with us directly. Alternatively, email editorial-team (at) simplywallst.com.
This article by Simply Wall St is general in nature. We provide commentary based on historical data and analyst forecasts only using an unbiased methodology and our articles are not intended to be financial advice. It does not constitute a recommendation to buy or sell any stock, and does not take account of your objectives, or your financial situation. We aim to bring you long-term focused analysis driven by fundamental data. Note that our analysis may not factor in the latest price-sensitive company announcements or qualitative material. Simply Wall St has no position in any stocks mentioned.
Have feedback on this article? Concerned about the content? Get in touch with us directly. Alternatively, email editorial-team@simplywallst.com
About KOSDAQ:A066700
Theragen EtexLtd
Engages in the research and development, production, and sale of pharmaceutical products in Korea.
Adequate balance sheet and slightly overvalued.
Similar Companies
Market Insights

Advertisement
Community Narratives
The Most Undervalued of the Magnificent 7
Fair Value US$237.43|36.3% undervalued
IN
Community Contributor
PVA TePla's New Strategy Aims for 22% Revenue Growth in Semiconductor Recovery
Fair Value €19.19|20.8% undervalued
MI
Community Contributor