
Advertisement
- South Korea
- /
- Biotech
- /
- KOSDAQ:A065660
Does Anterogen.Co.Ltd (KOSDAQ:065660) Have A Healthy Balance Sheet?

Howard Marks put it nicely when he said that, rather than worrying about share price volatility, 'The possibility of permanent loss is the risk I worry about... and every practical investor I know worries about.' So it might be obvious that you need to consider debt, when you think about how risky any given stock is, because too much debt can sink a company. We can see that Anterogen.Co.,Ltd. (KOSDAQ:065660) does use debt in its business. But the real question is whether this debt is making the company risky.
Why Does Debt Bring Risk?
Debt and other liabilities become risky for a business when it cannot easily fulfill those obligations, either with free cash flow or by raising capital at an attractive price. If things get really bad, the lenders can take control of the business. However, a more usual (but still expensive) situation is where a company must dilute shareholders at a cheap share price simply to get debt under control. Of course, debt can be an important tool in businesses, particularly capital heavy businesses. When we think about a company's use of debt, we first look at cash and debt together.
View our latest analysis for Anterogen.Co.Ltd
What Is Anterogen.Co.Ltd's Net Debt?
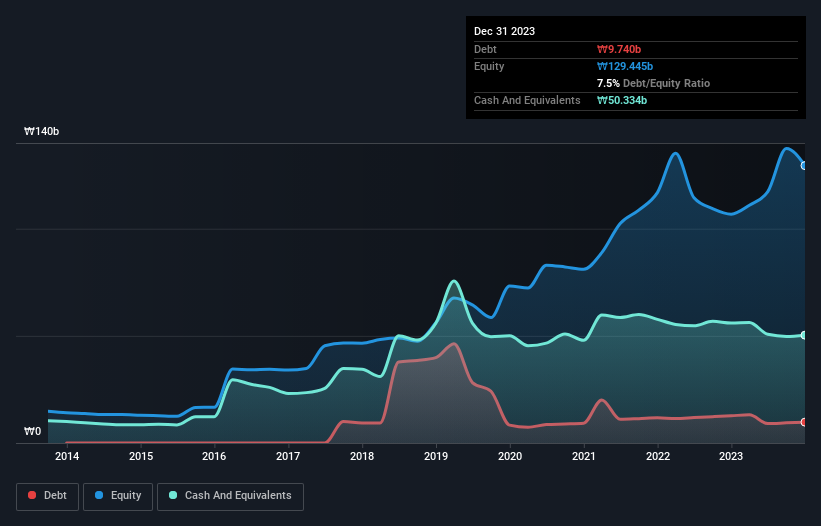
As you can see below, Anterogen.Co.Ltd had ₩9.74b of debt at December 2023, down from ₩12.7b a year prior. However, it does have ₩50.3b in cash offsetting this, leading to net cash of ₩40.6b.
How Healthy Is Anterogen.Co.Ltd's Balance Sheet?
We can see from the most recent balance sheet that Anterogen.Co.Ltd had liabilities of ₩10.8b falling due within a year, and liabilities of ₩9.23b due beyond that. On the other hand, it had cash of ₩50.3b and ₩3.37b worth of receivables due within a year. So it actually has ₩33.7b more liquid assets than total liabilities.
This excess liquidity suggests that Anterogen.Co.Ltd is taking a careful approach to debt. Because it has plenty of assets, it is unlikely to have trouble with its lenders. Simply put, the fact that Anterogen.Co.Ltd has more cash than debt is arguably a good indication that it can manage its debt safely. When analysing debt levels, the balance sheet is the obvious place to start. But you can't view debt in total isolation; since Anterogen.Co.Ltd will need earnings to service that debt. So if you're keen to discover more about its earnings, it might be worth checking out this graph of its long term earnings trend.
Over 12 months, Anterogen.Co.Ltd saw its revenue hold pretty steady, and it did not report positive earnings before interest and tax. While that hardly impresses, its not too bad either.
So How Risky Is Anterogen.Co.Ltd?
By their very nature companies that are losing money are more risky than those with a long history of profitability. And in the last year Anterogen.Co.Ltd had an earnings before interest and tax (EBIT) loss, truth be told. Indeed, in that time it burnt through ₩2.2b of cash and made a loss of ₩2.8b. While this does make the company a bit risky, it's important to remember it has net cash of ₩40.6b. That means it could keep spending at its current rate for more than two years. Overall, its balance sheet doesn't seem overly risky, at the moment, but we're always cautious until we see the positive free cash flow. When analysing debt levels, the balance sheet is the obvious place to start. However, not all investment risk resides within the balance sheet - far from it. For example, we've discovered 3 warning signs for Anterogen.Co.Ltd (1 makes us a bit uncomfortable!) that you should be aware of before investing here.
If you're interested in investing in businesses that can grow profits without the burden of debt, then check out this free list of growing businesses that have net cash on the balance sheet.
New: Manage All Your Stock Portfolios in One Place
We've created the ultimate portfolio companion for stock investors, and it's free.
• Connect an unlimited number of Portfolios and see your total in one currency
• Be alerted to new Warning Signs or Risks via email or mobile
• Track the Fair Value of your stocks
Have feedback on this article? Concerned about the content? Get in touch with us directly. Alternatively, email editorial-team (at) simplywallst.com.
This article by Simply Wall St is general in nature. We provide commentary based on historical data and analyst forecasts only using an unbiased methodology and our articles are not intended to be financial advice. It does not constitute a recommendation to buy or sell any stock, and does not take account of your objectives, or your financial situation. We aim to bring you long-term focused analysis driven by fundamental data. Note that our analysis may not factor in the latest price-sensitive company announcements or qualitative material. Simply Wall St has no position in any stocks mentioned.
About KOSDAQ:A065660
Anterogen.Co.Ltd
A bio-venture company, engages in the research, development, and commercialization of cell therapy products using adipose-derived stem cells in South Korea and internationally.
Flawless balance sheet very low.
Market Insights


Advertisement
Community Narratives
Nike's Direct-to-Consumer Focus Will Drive Future Growth
Fair Value US$87.90|18.2% undervalued
UN
Community Contributor
Novo Nordisk will dominate GLP-1 market with Ozempic and Wegovy growth
Fair Value US$89.59|12.1% undervalued
BE
Community Contributor
Rheinmetall could get 20-25% of EU-NATO 3%-GDP defence spending
Fair Value €7.57k|82.4% undervalued
NO
Community Contributor