- South Korea
- /
- Entertainment
- /
- KOSDAQ:A200350
Subdued Growth No Barrier To RaemongRaein Co., Ltd. (KOSDAQ:200350) With Shares Advancing 52%


RaemongRaein Co., Ltd. (KOSDAQ:200350) shares have had a really impressive month, gaining 52% after a shaky period beforehand. Not all shareholders will be feeling jubilant, since the share price is still down a very disappointing 21% in the last twelve months.
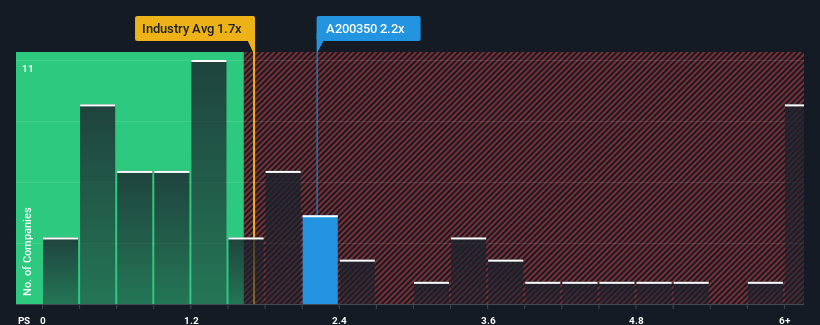
Following the firm bounce in price, when almost half of the companies in Korea's Entertainment industry have price-to-sales ratios (or "P/S") below 1.7x, you may consider RaemongRaein as a stock probably not worth researching with its 2.2x P/S ratio. However, the P/S might be high for a reason and it requires further investigation to determine if it's justified.
View our latest analysis for RaemongRaein
What Does RaemongRaein's Recent Performance Look Like?
For example, consider that RaemongRaein's financial performance has been poor lately as its revenue has been in decline. Perhaps the market believes the company can do enough to outperform the rest of the industry in the near future, which is keeping the P/S ratio high. However, if this isn't the case, investors might get caught out paying too much for the stock.
Want the full picture on earnings, revenue and cash flow for the company? Then our free report on RaemongRaein will help you shine a light on its historical performance.Do Revenue Forecasts Match The High P/S Ratio?
There's an inherent assumption that a company should outperform the industry for P/S ratios like RaemongRaein's to be considered reasonable.
Retrospectively, the last year delivered a frustrating 14% decrease to the company's top line. However, a few very strong years before that means that it was still able to grow revenue by an impressive 30% in total over the last three years. Although it's been a bumpy ride, it's still fair to say the revenue growth recently has been more than adequate for the company.
Comparing that to the industry, which is predicted to deliver 13% growth in the next 12 months, the company's momentum is weaker, based on recent medium-term annualised revenue results.
With this in mind, we find it worrying that RaemongRaein's P/S exceeds that of its industry peers. It seems most investors are ignoring the fairly limited recent growth rates and are hoping for a turnaround in the company's business prospects. Only the boldest would assume these prices are sustainable as a continuation of recent revenue trends is likely to weigh heavily on the share price eventually.
The Final Word
RaemongRaein's P/S is on the rise since its shares have risen strongly. It's argued the price-to-sales ratio is an inferior measure of value within certain industries, but it can be a powerful business sentiment indicator.
Our examination of RaemongRaein revealed its poor three-year revenue trends aren't detracting from the P/S as much as we though, given they look worse than current industry expectations. When we see slower than industry revenue growth but an elevated P/S, there's considerable risk of the share price declining, sending the P/S lower. If recent medium-term revenue trends continue, it will place shareholders' investments at significant risk and potential investors in danger of paying an excessive premium.
Don't forget that there may be other risks. For instance, we've identified 4 warning signs for RaemongRaein (1 is concerning) you should be aware of.
It's important to make sure you look for a great company, not just the first idea you come across. So if growing profitability aligns with your idea of a great company, take a peek at this free list of interesting companies with strong recent earnings growth (and a low P/E).
New: Manage All Your Stock Portfolios in One Place
We've created the ultimate portfolio companion for stock investors, and it's free.
• Connect an unlimited number of Portfolios and see your total in one currency
• Be alerted to new Warning Signs or Risks via email or mobile
• Track the Fair Value of your stocks
Have feedback on this article? Concerned about the content? Get in touch with us directly. Alternatively, email editorial-team (at) simplywallst.com.
This article by Simply Wall St is general in nature. We provide commentary based on historical data and analyst forecasts only using an unbiased methodology and our articles are not intended to be financial advice. It does not constitute a recommendation to buy or sell any stock, and does not take account of your objectives, or your financial situation. We aim to bring you long-term focused analysis driven by fundamental data. Note that our analysis may not factor in the latest price-sensitive company announcements or qualitative material. Simply Wall St has no position in any stocks mentioned.
About KOSDAQ:A200350
Artist Studio
Engages in the planning, producing, and selling drama contents and promotional materials.
Excellent balance sheet slight.
