

The external fund manager backed by Berkshire Hathaway's Charlie Munger, Li Lu, makes no bones about it when he says 'The biggest investment risk is not the volatility of prices, but whether you will suffer a permanent loss of capital.' So it seems the smart money knows that debt - which is usually involved in bankruptcies - is a very important factor, when you assess how risky a company is. Importantly, SANGBO Corp. (KOSDAQ:027580) does carry debt. But is this debt a concern to shareholders?
When Is Debt Dangerous?
Debt and other liabilities become risky for a business when it cannot easily fulfill those obligations, either with free cash flow or by raising capital at an attractive price. Part and parcel of capitalism is the process of 'creative destruction' where failed businesses are mercilessly liquidated by their bankers. However, a more usual (but still expensive) situation is where a company must dilute shareholders at a cheap share price simply to get debt under control. By replacing dilution, though, debt can be an extremely good tool for businesses that need capital to invest in growth at high rates of return. The first step when considering a company's debt levels is to consider its cash and debt together.
Check out our latest analysis for SANGBO
How Much Debt Does SANGBO Carry?
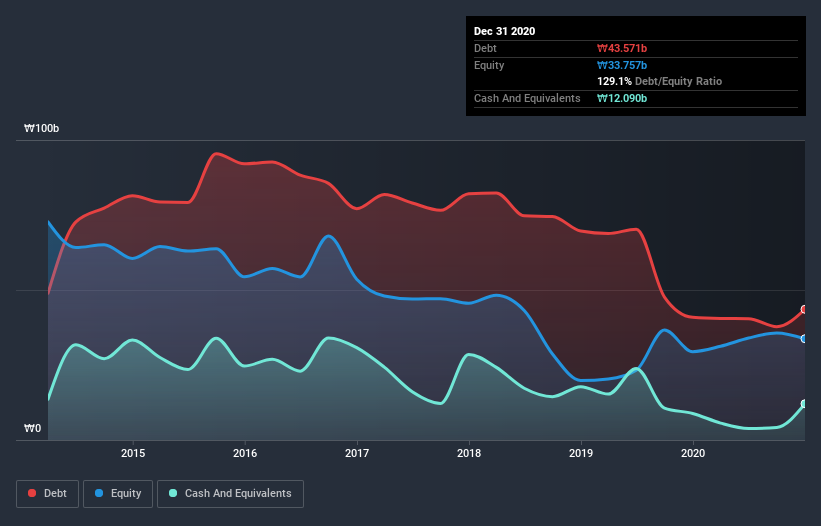
The image below, which you can click on for greater detail, shows that at December 2020 SANGBO had debt of ₩43.6b, up from ₩40.9b in one year. However, it also had ₩12.1b in cash, and so its net debt is ₩31.5b.
How Strong Is SANGBO's Balance Sheet?
The latest balance sheet data shows that SANGBO had liabilities of ₩71.8b due within a year, and liabilities of ₩5.61b falling due after that. Offsetting this, it had ₩12.1b in cash and ₩40.3b in receivables that were due within 12 months. So its liabilities outweigh the sum of its cash and (near-term) receivables by ₩25.0b.
This deficit isn't so bad because SANGBO is worth ₩82.5b, and thus could probably raise enough capital to shore up its balance sheet, if the need arose. But it's clear that we should definitely closely examine whether it can manage its debt without dilution.
We use two main ratios to inform us about debt levels relative to earnings. The first is net debt divided by earnings before interest, tax, depreciation, and amortization (EBITDA), while the second is how many times its earnings before interest and tax (EBIT) covers its interest expense (or its interest cover, for short). Thus we consider debt relative to earnings both with and without depreciation and amortization expenses.
While we wouldn't worry about SANGBO's net debt to EBITDA ratio of 2.6, we think its super-low interest cover of 1.9 times is a sign of high leverage. So shareholders should probably be aware that interest expenses appear to have really impacted the business lately. One redeeming factor for SANGBO is that it turned last year's EBIT loss into a gain of ₩7.4b, over the last twelve months. The balance sheet is clearly the area to focus on when you are analysing debt. But you can't view debt in total isolation; since SANGBO will need earnings to service that debt. So when considering debt, it's definitely worth looking at the earnings trend. Click here for an interactive snapshot.
Finally, a company can only pay off debt with cold hard cash, not accounting profits. So it is important to check how much of its earnings before interest and tax (EBIT) converts to actual free cash flow. In the last year, SANGBO's free cash flow amounted to 27% of its EBIT, less than we'd expect. That weak cash conversion makes it more difficult to handle indebtedness.
Our View
SANGBO's interest cover was a real negative on this analysis, although the other factors we considered cast it in a significantly better light. For example, its EBIT growth rate is relatively strong. When we consider all the factors discussed, it seems to us that SANGBO is taking some risks with its use of debt. So while that leverage does boost returns on equity, we wouldn't really want to see it increase from here. The balance sheet is clearly the area to focus on when you are analysing debt. However, not all investment risk resides within the balance sheet - far from it. To that end, you should learn about the 3 warning signs we've spotted with SANGBO (including 1 which is potentially serious) .
When all is said and done, sometimes its easier to focus on companies that don't even need debt. Readers can access a list of growth stocks with zero net debt 100% free, right now.
If you decide to trade SANGBO, use the lowest-cost* platform that is rated #1 Overall by Barron’s, Interactive Brokers. Trade stocks, options, futures, forex, bonds and funds on 135 markets, all from a single integrated account. Promoted
New: Manage All Your Stock Portfolios in One Place
We've created the ultimate portfolio companion for stock investors, and it's free.
• Connect an unlimited number of Portfolios and see your total in one currency
• Be alerted to new Warning Signs or Risks via email or mobile
• Track the Fair Value of your stocks
This article by Simply Wall St is general in nature. It does not constitute a recommendation to buy or sell any stock, and does not take account of your objectives, or your financial situation. We aim to bring you long-term focused analysis driven by fundamental data. Note that our analysis may not factor in the latest price-sensitive company announcements or qualitative material. Simply Wall St has no position in any stocks mentioned.
*Interactive Brokers Rated Lowest Cost Broker by StockBrokers.com Annual Online Review 2020
Have feedback on this article? Concerned about the content? Get in touch with us directly. Alternatively, email editorial-team (at) simplywallst.com.
About KOSDAQ:A027580
SANGBO
Manufactures and sells thin films, and nano coating and materials in South Korea and internationally.
Adequate balance sheet very low.
Market Insights

Community Narratives

