
Advertisement
- South Korea
- /
- Packaging
- /
- KOSDAQ:A014970
SAMRYOONG Co.,Ltd's (KOSDAQ:014970) 32% Share Price Surge Not Quite Adding Up
SAMRYOONG Co.,Ltd (KOSDAQ:014970) shareholders have had their patience rewarded with a 32% share price jump in the last month. Notwithstanding the latest gain, the annual share price return of 6.6% isn't as impressive.
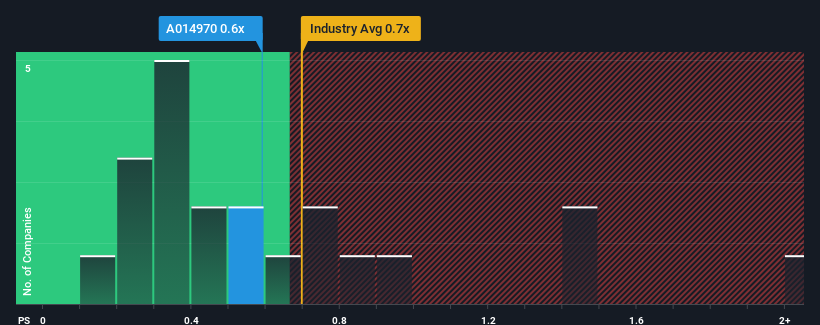
Even after such a large jump in price, you could still be forgiven for feeling indifferent about SAMRYOONGLtd's P/S ratio of 0.6x, since the median price-to-sales (or "P/S") ratio for the Packaging industry in Korea is also close to 0.4x. However, investors might be overlooking a clear opportunity or potential setback if there is no rational basis for the P/S.
View our latest analysis for SAMRYOONGLtd
What Does SAMRYOONGLtd's Recent Performance Look Like?
SAMRYOONGLtd has been doing a good job lately as it's been growing revenue at a solid pace. It might be that many expect the respectable revenue performance to wane, which has kept the P/S from rising. If that doesn't eventuate, then existing shareholders probably aren't too pessimistic about the future direction of the share price.
Although there are no analyst estimates available for SAMRYOONGLtd, take a look at this free data-rich visualisation to see how the company stacks up on earnings, revenue and cash flow.Is There Some Revenue Growth Forecasted For SAMRYOONGLtd?
In order to justify its P/S ratio, SAMRYOONGLtd would need to produce growth that's similar to the industry.
If we review the last year of revenue growth, the company posted a worthy increase of 9.0%. The solid recent performance means it was also able to grow revenue by 7.2% in total over the last three years. Accordingly, shareholders would have probably been satisfied with the medium-term rates of revenue growth.
Comparing the recent medium-term revenue trends against the industry's one-year growth forecast of 21% shows it's noticeably less attractive.
With this in mind, we find it intriguing that SAMRYOONGLtd's P/S is comparable to that of its industry peers. It seems most investors are ignoring the fairly limited recent growth rates and are willing to pay up for exposure to the stock. Maintaining these prices will be difficult to achieve as a continuation of recent revenue trends is likely to weigh down the shares eventually.
The Bottom Line On SAMRYOONGLtd's P/S
SAMRYOONGLtd appears to be back in favour with a solid price jump bringing its P/S back in line with other companies in the industry Using the price-to-sales ratio alone to determine if you should sell your stock isn't sensible, however it can be a practical guide to the company's future prospects.
We've established that SAMRYOONGLtd's average P/S is a bit surprising since its recent three-year growth is lower than the wider industry forecast. When we see weak revenue with slower than industry growth, we suspect the share price is at risk of declining, bringing the P/S back in line with expectations. Unless the recent medium-term conditions improve, it's hard to accept the current share price as fair value.
Before you settle on your opinion, we've discovered 2 warning signs for SAMRYOONGLtd that you should be aware of.
If you're unsure about the strength of SAMRYOONGLtd's business, why not explore our interactive list of stocks with solid business fundamentals for some other companies you may have missed.
New: Manage All Your Stock Portfolios in One Place
We've created the ultimate portfolio companion for stock investors, and it's free.
• Connect an unlimited number of Portfolios and see your total in one currency
• Be alerted to new Warning Signs or Risks via email or mobile
• Track the Fair Value of your stocks
Have feedback on this article? Concerned about the content? Get in touch with us directly. Alternatively, email editorial-team (at) simplywallst.com.
This article by Simply Wall St is general in nature. We provide commentary based on historical data and analyst forecasts only using an unbiased methodology and our articles are not intended to be financial advice. It does not constitute a recommendation to buy or sell any stock, and does not take account of your objectives, or your financial situation. We aim to bring you long-term focused analysis driven by fundamental data. Note that our analysis may not factor in the latest price-sensitive company announcements or qualitative material. Simply Wall St has no position in any stocks mentioned.
About KOSDAQ:A014970
Adequate balance sheet and slightly overvalued.
Market Insights

Advertisement
Community Narratives
MINISO's fair value is projected at 26.69 with an anticipated PE ratio shift of 20x
Fair Value US$24.03|12.0% undervalued
BE
Community Contributor
Procter & Gamble: A Dividend Giant Facing Slowing Growth
Fair Value US$119.81|21.7% overvalued
AN
Community Contributor
Eli Lilly's Future Growth Driven by Tirzepatide and Favorable Market Conditions
Fair Value US$1.19k|14.1% undervalued
EA
Community Contributor