
Advertisement
- South Korea
- /
- Insurance
- /
- KOSE:A000810
Samsung Fire & Marine Insurance's (KRX:000810) earnings growth rate lags the 24% CAGR delivered to shareholders
The worst result, after buying shares in a company (assuming no leverage), would be if you lose all the money you put in. But on the bright side, you can make far more than 100% on a really good stock. One great example is Samsung Fire & Marine Insurance Co., Ltd. (KRX:000810) which saw its share price drive 123% higher over five years. The last week saw the share price soften some 3.3%.
Although Samsung Fire & Marine Insurance has shed ₩638b from its market cap this week, let's take a look at its longer term fundamental trends and see if they've driven returns.
To quote Buffett, 'Ships will sail around the world but the Flat Earth Society will flourish. There will continue to be wide discrepancies between price and value in the marketplace...' One way to examine how market sentiment has changed over time is to look at the interaction between a company's share price and its earnings per share (EPS).
During five years of share price growth, Samsung Fire & Marine Insurance achieved compound earnings per share (EPS) growth of 22% per year. The EPS growth is more impressive than the yearly share price gain of 17% over the same period. Therefore, it seems the market has become relatively pessimistic about the company. This cautious sentiment is reflected in its (fairly low) P/E ratio of 10.32.
You can see below how EPS has changed over time (discover the exact values by clicking on the image).
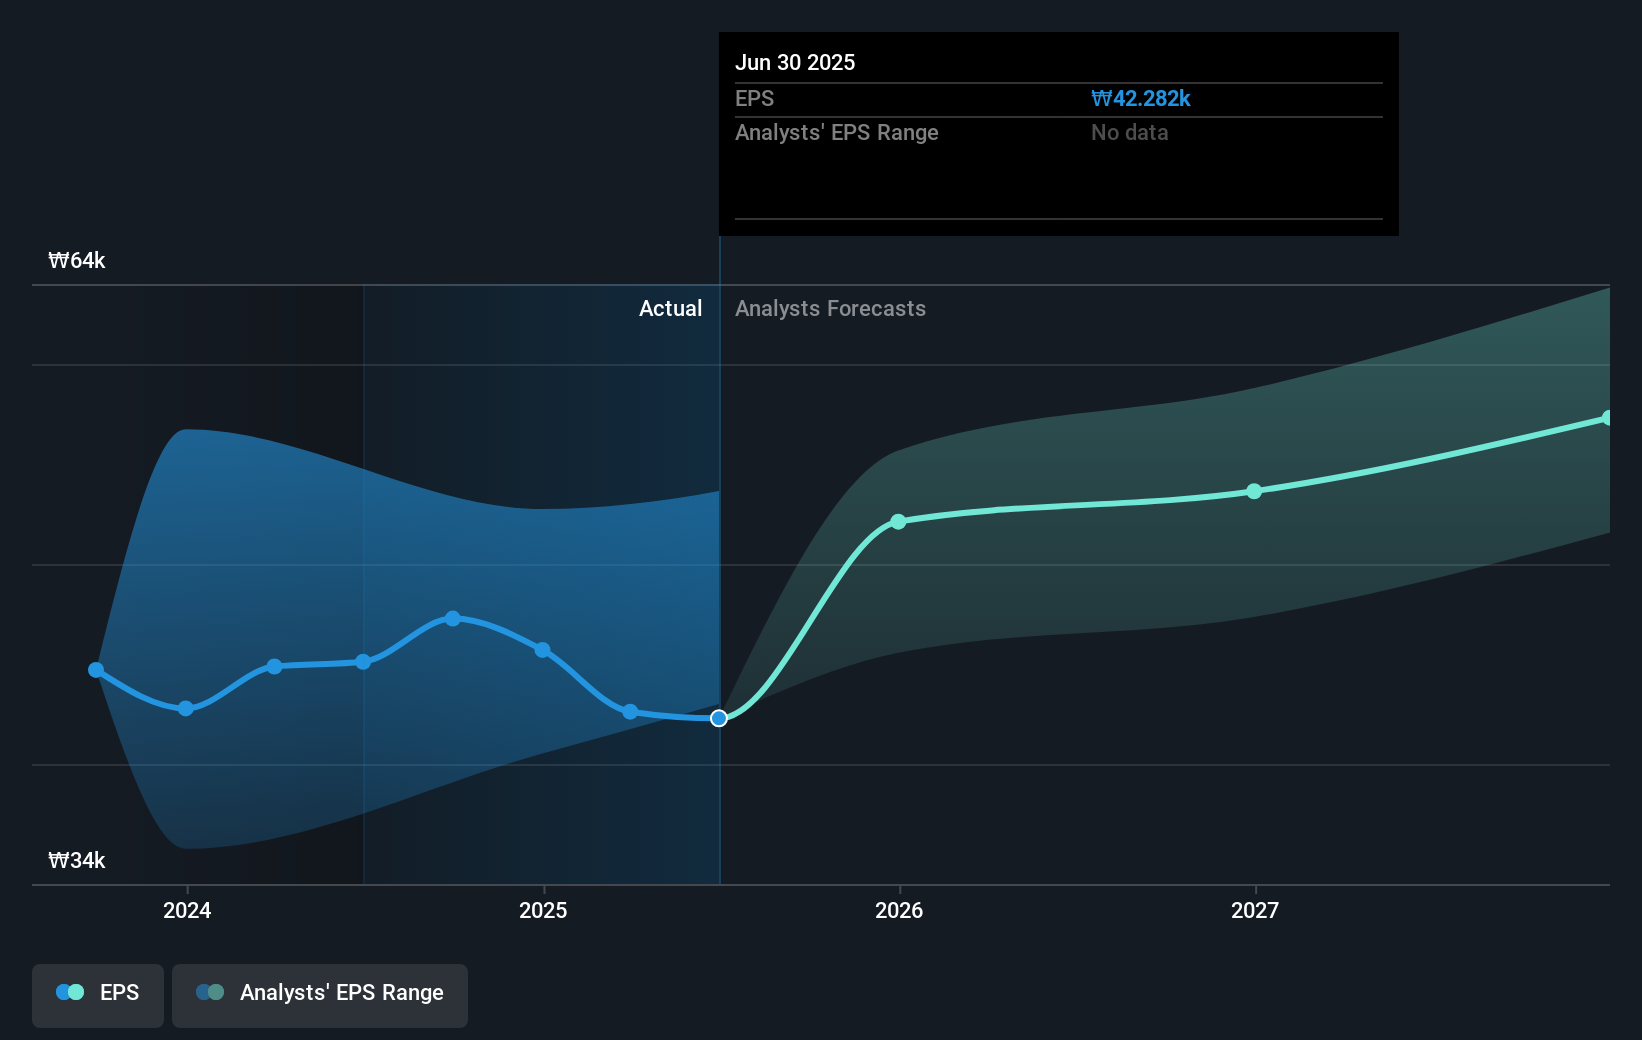
Dive deeper into Samsung Fire & Marine Insurance's key metrics by checking this interactive graph of Samsung Fire & Marine Insurance's earnings, revenue and cash flow.
What About Dividends?
It is important to consider the total shareholder return, as well as the share price return, for any given stock. Whereas the share price return only reflects the change in the share price, the TSR includes the value of dividends (assuming they were reinvested) and the benefit of any discounted capital raising or spin-off. So for companies that pay a generous dividend, the TSR is often a lot higher than the share price return. We note that for Samsung Fire & Marine Insurance the TSR over the last 5 years was 192%, which is better than the share price return mentioned above. This is largely a result of its dividend payments!
A Different Perspective
Samsung Fire & Marine Insurance shareholders gained a total return of 30% during the year. But that was short of the market average. The silver lining is that the gain was actually better than the average annual return of 24% per year over five year. This could indicate that the company is winning over new investors, as it pursues its strategy. It's always interesting to track share price performance over the longer term. But to understand Samsung Fire & Marine Insurance better, we need to consider many other factors. Take risks, for example - Samsung Fire & Marine Insurance has 2 warning signs we think you should be aware of.
Of course Samsung Fire & Marine Insurance may not be the best stock to buy. So you may wish to see this free collection of growth stocks.
Please note, the market returns quoted in this article reflect the market weighted average returns of stocks that currently trade on South Korean exchanges.
New: Manage All Your Stock Portfolios in One Place
We've created the ultimate portfolio companion for stock investors, and it's free.
• Connect an unlimited number of Portfolios and see your total in one currency
• Be alerted to new Warning Signs or Risks via email or mobile
• Track the Fair Value of your stocks
Have feedback on this article? Concerned about the content? Get in touch with us directly. Alternatively, email editorial-team (at) simplywallst.com.
This article by Simply Wall St is general in nature. We provide commentary based on historical data and analyst forecasts only using an unbiased methodology and our articles are not intended to be financial advice. It does not constitute a recommendation to buy or sell any stock, and does not take account of your objectives, or your financial situation. We aim to bring you long-term focused analysis driven by fundamental data. Note that our analysis may not factor in the latest price-sensitive company announcements or qualitative material. Simply Wall St has no position in any stocks mentioned.
About KOSE:A000810
Samsung Fire & Marine Insurance
Provides non-life insurance products and services in South Korea, China, Indonesia, Vietnam, Singapore, the United States, and the United Kingdom.
Established dividend payer with adequate balance sheet.
Market Insights

Advertisement
Community Narratives
Kodiak AI - a potential 100 bagger opportunity?
Fair Value US$14.00|44.7% undervalued
DA
Community Contributor
A Fair Price for a Great Business Facing Real Threats
Fair Value US$383.06|13.0% undervalued
IM
Community Contributor
AXON And Shopify Integration Will Unlock Global Mobile Advertising
Fair Value US$646.30|0% overvalued
AN
Based on Analyst Price Targets