- South Korea
- /
- Personal Products
- /
- KOSDAQ:A214260
Raphas Co., Ltd.'s (KOSDAQ:214260) 27% Dip Still Leaving Some Shareholders Feeling Restless Over Its P/SRatio


Unfortunately for some shareholders, the Raphas Co., Ltd. (KOSDAQ:214260) share price has dived 27% in the last thirty days, prolonging recent pain. The recent drop completes a disastrous twelve months for shareholders, who are sitting on a 52% loss during that time.
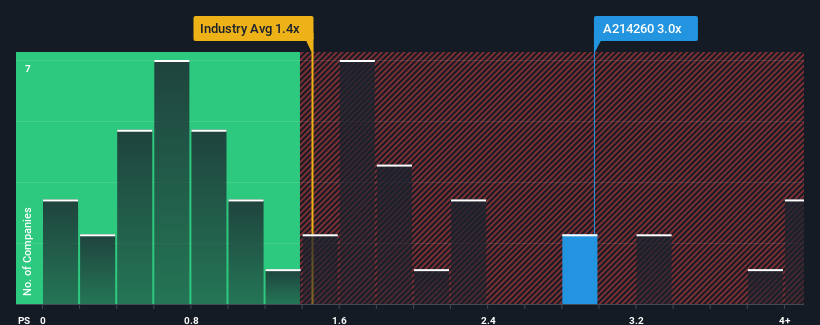
Although its price has dipped substantially, you could still be forgiven for thinking Raphas is a stock not worth researching with a price-to-sales ratios (or "P/S") of 3x, considering almost half the companies in Korea's Personal Products industry have P/S ratios below 1.4x. Although, it's not wise to just take the P/S at face value as there may be an explanation why it's as high as it is.
Check out our latest analysis for Raphas
How Has Raphas Performed Recently?
Raphas has been doing a decent job lately as it's been growing revenue at a reasonable pace. It might be that many expect the reasonable revenue performance to beat most other companies over the coming period, which has increased investors’ willingness to pay up for the stock. If not, then existing shareholders may be a little nervous about the viability of the share price.
Want the full picture on earnings, revenue and cash flow for the company? Then our free report on Raphas will help you shine a light on its historical performance.How Is Raphas' Revenue Growth Trending?
The only time you'd be truly comfortable seeing a P/S as high as Raphas' is when the company's growth is on track to outshine the industry.
If we review the last year of revenue growth, the company posted a worthy increase of 6.9%. Pleasingly, revenue has also lifted 72% in aggregate from three years ago, partly thanks to the last 12 months of growth. Therefore, it's fair to say the revenue growth recently has been superb for the company.
Weighing that recent medium-term revenue trajectory against the broader industry's one-year forecast for expansion of 20% shows it's about the same on an annualised basis.
In light of this, it's curious that Raphas' P/S sits above the majority of other companies. Apparently many investors in the company are more bullish than recent times would indicate and aren't willing to let go of their stock right now. Although, additional gains will be difficult to achieve as a continuation of recent revenue trends would weigh down the share price eventually.
The Key Takeaway
There's still some elevation in Raphas' P/S, even if the same can't be said for its share price recently. Using the price-to-sales ratio alone to determine if you should sell your stock isn't sensible, however it can be a practical guide to the company's future prospects.
Our examination of Raphas revealed its three-year revenue trends aren't impacting its high P/S as much as we would have predicted, given they look similar to current industry expectations. Right now we are uncomfortable with the high P/S as this revenue performance isn't likely to support such positive sentiment for long. Unless the recent medium-term conditions improve, it's challenging to accept these prices as being reasonable.
Before you settle on your opinion, we've discovered 2 warning signs for Raphas (1 is significant!) that you should be aware of.
If you're unsure about the strength of Raphas' business, why not explore our interactive list of stocks with solid business fundamentals for some other companies you may have missed.
If you're looking to trade Raphas, open an account with the lowest-cost platform trusted by professionals, Interactive Brokers.
With clients in over 200 countries and territories, and access to 160 markets, IBKR lets you trade stocks, options, futures, forex, bonds and funds from a single integrated account.
Enjoy no hidden fees, no account minimums, and FX conversion rates as low as 0.03%, far better than what most brokers offer.
Sponsored ContentNew: AI Stock Screener & Alerts
Our new AI Stock Screener scans the market every day to uncover opportunities.
• Dividend Powerhouses (3%+ Yield)
• Undervalued Small Caps with Insider Buying
• High growth Tech and AI Companies
Or build your own from over 50 metrics.
Have feedback on this article? Concerned about the content? Get in touch with us directly. Alternatively, email editorial-team (at) simplywallst.com.
This article by Simply Wall St is general in nature. We provide commentary based on historical data and analyst forecasts only using an unbiased methodology and our articles are not intended to be financial advice. It does not constitute a recommendation to buy or sell any stock, and does not take account of your objectives, or your financial situation. We aim to bring you long-term focused analysis driven by fundamental data. Note that our analysis may not factor in the latest price-sensitive company announcements or qualitative material. Simply Wall St has no position in any stocks mentioned.
Have feedback on this article? Concerned about the content? Get in touch with us directly. Alternatively, email editorial-team@simplywallst.com
About KOSDAQ:A214260
Adequate balance sheet very low.
Market Insights

Community Narratives

