
Advertisement
- South Korea
- /
- Personal Products
- /
- KOSDAQ:A083660
Health Check: How Prudently Does Csa Cosmic (KOSDAQ:083660) Use Debt?
David Iben put it well when he said, 'Volatility is not a risk we care about. What we care about is avoiding the permanent loss of capital.' It's only natural to consider a company's balance sheet when you examine how risky it is, since debt is often involved when a business collapses. We can see that Csa Cosmic Co., Ltd. (KOSDAQ:083660) does use debt in its business. But the real question is whether this debt is making the company risky.
When Is Debt Dangerous?
Debt is a tool to help businesses grow, but if a business is incapable of paying off its lenders, then it exists at their mercy. In the worst case scenario, a company can go bankrupt if it cannot pay its creditors. However, a more frequent (but still costly) occurrence is where a company must issue shares at bargain-basement prices, permanently diluting shareholders, just to shore up its balance sheet. Of course, plenty of companies use debt to fund growth, without any negative consequences. When we think about a company's use of debt, we first look at cash and debt together.
How Much Debt Does Csa Cosmic Carry?
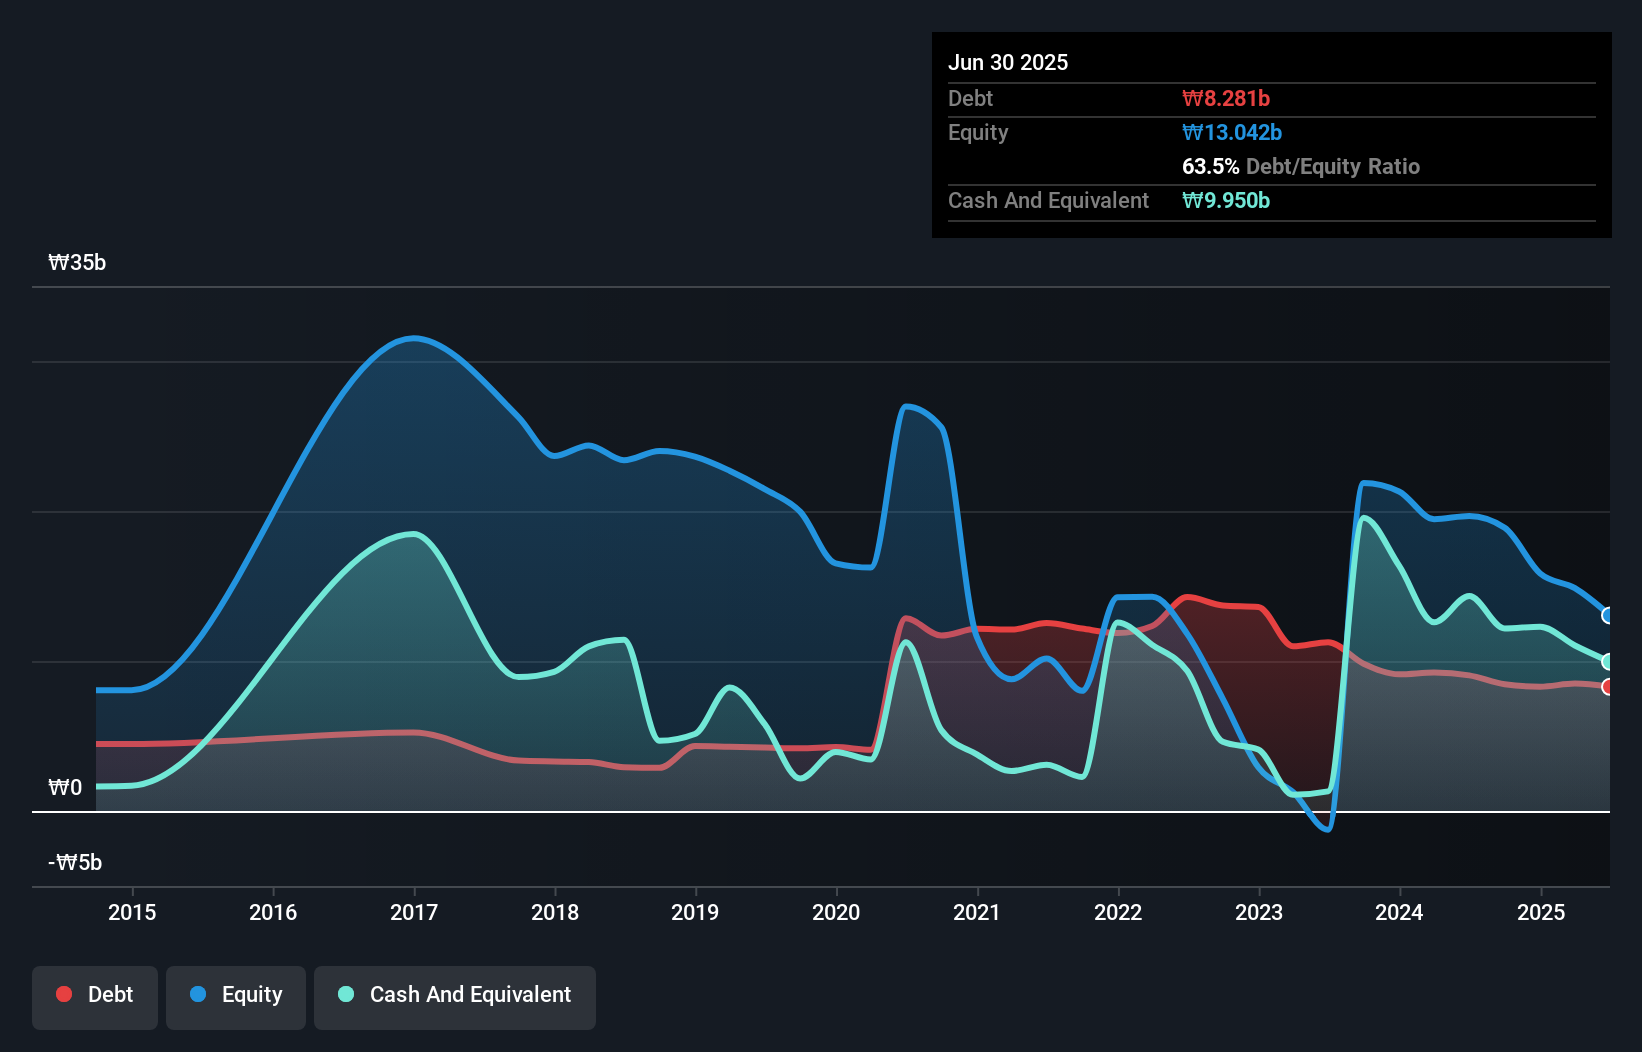
You can click the graphic below for the historical numbers, but it shows that Csa Cosmic had ₩8.28b of debt in June 2025, down from ₩9.04b, one year before. However, it does have ₩9.95b in cash offsetting this, leading to net cash of ₩1.67b.
A Look At Csa Cosmic's Liabilities
The latest balance sheet data shows that Csa Cosmic had liabilities of ₩16.3b due within a year, and liabilities of ₩397.2m falling due after that. On the other hand, it had cash of ₩9.95b and ₩6.24b worth of receivables due within a year. So it has liabilities totalling ₩529.9m more than its cash and near-term receivables, combined.
Having regard to Csa Cosmic's size, it seems that its liquid assets are well balanced with its total liabilities. So it's very unlikely that the ₩49.3b company is short on cash, but still worth keeping an eye on the balance sheet. While it does have liabilities worth noting, Csa Cosmic also has more cash than debt, so we're pretty confident it can manage its debt safely. There's no doubt that we learn most about debt from the balance sheet. But it is Csa Cosmic's earnings that will influence how the balance sheet holds up in the future. So if you're keen to discover more about its earnings, it might be worth checking out this graph of its long term earnings trend.
View our latest analysis for Csa Cosmic
In the last year Csa Cosmic had a loss before interest and tax, and actually shrunk its revenue by 22%, to ₩32b. To be frank that doesn't bode well.
So How Risky Is Csa Cosmic?
We have no doubt that loss making companies are, in general, riskier than profitable ones. And the fact is that over the last twelve months Csa Cosmic lost money at the earnings before interest and tax (EBIT) line. And over the same period it saw negative free cash outflow of ₩1.3b and booked a ₩6.7b accounting loss. But the saving grace is the ₩1.67b on the balance sheet. That means it could keep spending at its current rate for more than two years. Overall, we'd say the stock is a bit risky, and we're usually very cautious until we see positive free cash flow. The balance sheet is clearly the area to focus on when you are analysing debt. But ultimately, every company can contain risks that exist outside of the balance sheet. Be aware that Csa Cosmic is showing 2 warning signs in our investment analysis , and 1 of those can't be ignored...
At the end of the day, it's often better to focus on companies that are free from net debt. You can access our special list of such companies (all with a track record of profit growth). It's free.
New: AI Stock Screener & Alerts
Our new AI Stock Screener scans the market every day to uncover opportunities.
• Dividend Powerhouses (3%+ Yield)
• Undervalued Small Caps with Insider Buying
• High growth Tech and AI Companies
Or build your own from over 50 metrics.
Have feedback on this article? Concerned about the content? Get in touch with us directly. Alternatively, email editorial-team (at) simplywallst.com.
This article by Simply Wall St is general in nature. We provide commentary based on historical data and analyst forecasts only using an unbiased methodology and our articles are not intended to be financial advice. It does not constitute a recommendation to buy or sell any stock, and does not take account of your objectives, or your financial situation. We aim to bring you long-term focused analysis driven by fundamental data. Note that our analysis may not factor in the latest price-sensitive company announcements or qualitative material. Simply Wall St has no position in any stocks mentioned.
About KOSDAQ:A083660
Csa Cosmic
Engages in the manufacture and sale of cosmetics in South Korea.
Excellent balance sheet with very low risk.
Market Insights

Advertisement
Community Narratives
Kodiak AI - a potential 100 bagger opportunity?
Fair Value US$14.00|44.7% undervalued
DA
Community Contributor
A Fair Price for a Great Business Facing Real Threats
Fair Value US$383.06|13.0% undervalued
IM
Community Contributor
AXON And Shopify Integration Will Unlock Global Mobile Advertising
Fair Value US$646.30|0% overvalued
AN
Based on Analyst Price Targets