- South Korea
- /
- Medical Equipment
- /
- KOSDAQ:A340570
Are T&L Co., Ltd. (KOSDAQ:340570) Investors Paying Above The Intrinsic Value?


Key Insights
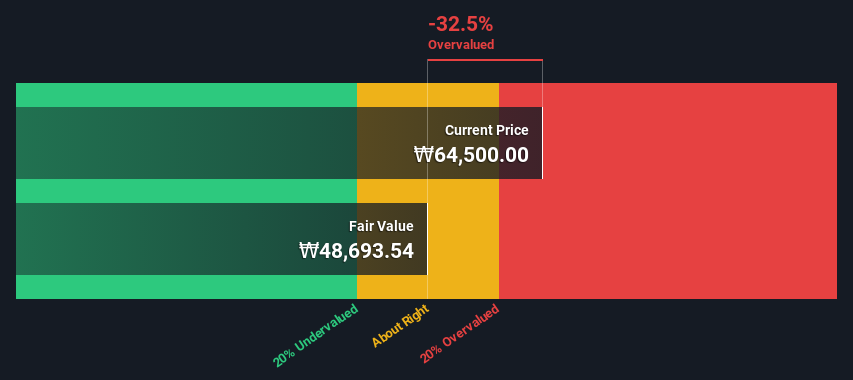
- Using the 2 Stage Free Cash Flow to Equity, T&L fair value estimate is ₩48,694
- T&L is estimated to be 32% overvalued based on current share price of ₩64,500
- The ₩85,500 analyst price target for A340570 is 76% more than our estimate of fair value
Today we will run through one way of estimating the intrinsic value of T&L Co., Ltd. (KOSDAQ:340570) by projecting its future cash flows and then discounting them to today's value. We will use the Discounted Cash Flow (DCF) model on this occasion. It may sound complicated, but actually it is quite simple!
Companies can be valued in a lot of ways, so we would point out that a DCF is not perfect for every situation. Anyone interested in learning a bit more about intrinsic value should have a read of the Simply Wall St analysis model.
View our latest analysis for T&L
Crunching The Numbers
We use what is known as a 2-stage model, which simply means we have two different periods of growth rates for the company's cash flows. Generally the first stage is higher growth, and the second stage is a lower growth phase. To begin with, we have to get estimates of the next ten years of cash flows. Where possible we use analyst estimates, but when these aren't available we extrapolate the previous free cash flow (FCF) from the last estimate or reported value. We assume companies with shrinking free cash flow will slow their rate of shrinkage, and that companies with growing free cash flow will see their growth rate slow, over this period. We do this to reflect that growth tends to slow more in the early years than it does in later years.
A DCF is all about the idea that a dollar in the future is less valuable than a dollar today, so we need to discount the sum of these future cash flows to arrive at a present value estimate:
10-year free cash flow (FCF) estimate
| 2025 | 2026 | 2027 | 2028 | 2029 | 2030 | 2031 | 2032 | 2033 | 2034 | |
| Levered FCF (₩, Millions) | ₩31.0b | ₩26.7b | ₩24.3b | ₩22.9b | ₩22.2b | ₩21.8b | ₩21.8b | ₩21.9b | ₩22.1b | ₩22.5b |
| Growth Rate Estimate Source | Analyst x1 | Est @ -13.98% | Est @ -9.05% | Est @ -5.59% | Est @ -3.17% | Est @ -1.47% | Est @ -0.29% | Est @ 0.54% | Est @ 1.12% | Est @ 1.53% |
| Present Value (₩, Millions) Discounted @ 7.4% | ₩28.9k | ₩23.1k | ₩19.6k | ₩17.2k | ₩15.5k | ₩14.2k | ₩13.2k | ₩12.3k | ₩11.6k | ₩11.0k |
("Est" = FCF growth rate estimated by Simply Wall St)
Present Value of 10-year Cash Flow (PVCF) = ₩166b
The second stage is also known as Terminal Value, this is the business's cash flow after the first stage. For a number of reasons a very conservative growth rate is used that cannot exceed that of a country's GDP growth. In this case we have used the 5-year average of the 10-year government bond yield (2.5%) to estimate future growth. In the same way as with the 10-year 'growth' period, we discount future cash flows to today's value, using a cost of equity of 7.4%.
Terminal Value (TV)= FCF2034 × (1 + g) ÷ (r – g) = ₩22b× (1 + 2.5%) ÷ (7.4%– 2.5%) = ₩464b
Present Value of Terminal Value (PVTV)= TV / (1 + r)10= ₩464b÷ ( 1 + 7.4%)10= ₩227b
The total value is the sum of cash flows for the next ten years plus the discounted terminal value, which results in the Total Equity Value, which in this case is ₩393b. The last step is to then divide the equity value by the number of shares outstanding. Relative to the current share price of ₩65k, the company appears reasonably expensive at the time of writing. Remember though, that this is just an approximate valuation, and like any complex formula - garbage in, garbage out.
Important Assumptions
Now the most important inputs to a discounted cash flow are the discount rate, and of course, the actual cash flows. Part of investing is coming up with your own evaluation of a company's future performance, so try the calculation yourself and check your own assumptions. The DCF also does not consider the possible cyclicality of an industry, or a company's future capital requirements, so it does not give a full picture of a company's potential performance. Given that we are looking at T&L as potential shareholders, the cost of equity is used as the discount rate, rather than the cost of capital (or weighted average cost of capital, WACC) which accounts for debt. In this calculation we've used 7.4%, which is based on a levered beta of 0.933. Beta is a measure of a stock's volatility, compared to the market as a whole. We get our beta from the industry average beta of globally comparable companies, with an imposed limit between 0.8 and 2.0, which is a reasonable range for a stable business.
SWOT Analysis for T&L
- Earnings growth over the past year exceeded the industry.
- Currently debt free.
- Dividends are covered by earnings and cash flows.
- Earnings growth over the past year is below its 5-year average.
- Dividend is low compared to the top 25% of dividend payers in the Medical Equipment market.
- Annual earnings are forecast to grow faster than the South Korean market.
- Good value based on P/E ratio compared to estimated Fair P/E ratio.
- No apparent threats visible for A340570.
Moving On:
Whilst important, the DCF calculation ideally won't be the sole piece of analysis you scrutinize for a company. The DCF model is not a perfect stock valuation tool. Preferably you'd apply different cases and assumptions and see how they would impact the company's valuation. For example, changes in the company's cost of equity or the risk free rate can significantly impact the valuation. What is the reason for the share price exceeding the intrinsic value? For T&L, we've compiled three relevant items you should assess:
- Risks: Case in point, we've spotted 1 warning sign for T&L you should be aware of.
- Future Earnings: How does A340570's growth rate compare to its peers and the wider market? Dig deeper into the analyst consensus number for the upcoming years by interacting with our free analyst growth expectation chart.
- Other High Quality Alternatives: Do you like a good all-rounder? Explore our interactive list of high quality stocks to get an idea of what else is out there you may be missing!
PS. The Simply Wall St app conducts a discounted cash flow valuation for every stock on the KOSDAQ every day. If you want to find the calculation for other stocks just search here.
Valuation is complex, but we're here to simplify it.
Discover if T&L might be undervalued or overvalued with our detailed analysis, featuring fair value estimates, potential risks, dividends, insider trades, and its financial condition.
Access Free AnalysisHave feedback on this article? Concerned about the content? Get in touch with us directly. Alternatively, email editorial-team (at) simplywallst.com.
This article by Simply Wall St is general in nature. We provide commentary based on historical data and analyst forecasts only using an unbiased methodology and our articles are not intended to be financial advice. It does not constitute a recommendation to buy or sell any stock, and does not take account of your objectives, or your financial situation. We aim to bring you long-term focused analysis driven by fundamental data. Note that our analysis may not factor in the latest price-sensitive company announcements or qualitative material. Simply Wall St has no position in any stocks mentioned.
Have feedback on this article? Concerned about the content? Get in touch with us directly. Alternatively, email editorial-team@simplywallst.com
About KOSDAQ:A340570
T&L
Engages in the manufacture and sale of medical and polymer material products in South Korea.
Very undervalued with exceptional growth potential.
Market Insights

Community Narratives

