- South Korea
- /
- Healthtech
- /
- KOSDAQ:A322510
Further weakness as JLKInc (KOSDAQ:322510) drops 15% this week, taking one-year losses to 60%

The nature of investing is that you win some, and you lose some. Anyone who held JLK,Inc. (KOSDAQ:322510) over the last year knows what a loser feels like. In that relatively short period, the share price has plunged 63%. On the other hand, the stock is actually up 42% over three years. Furthermore, it's down 23% in about a quarter. That's not much fun for holders. This could be related to the recent financial results - you can catch up on the most recent data by reading our company report.
Since JLKInc has shed ₩31b from its value in the past 7 days, let's see if the longer term decline has been driven by the business' economics.
See our latest analysis for JLKInc
JLKInc isn't currently profitable, so most analysts would look to revenue growth to get an idea of how fast the underlying business is growing. When a company doesn't make profits, we'd generally hope to see good revenue growth. That's because fast revenue growth can be easily extrapolated to forecast profits, often of considerable size.
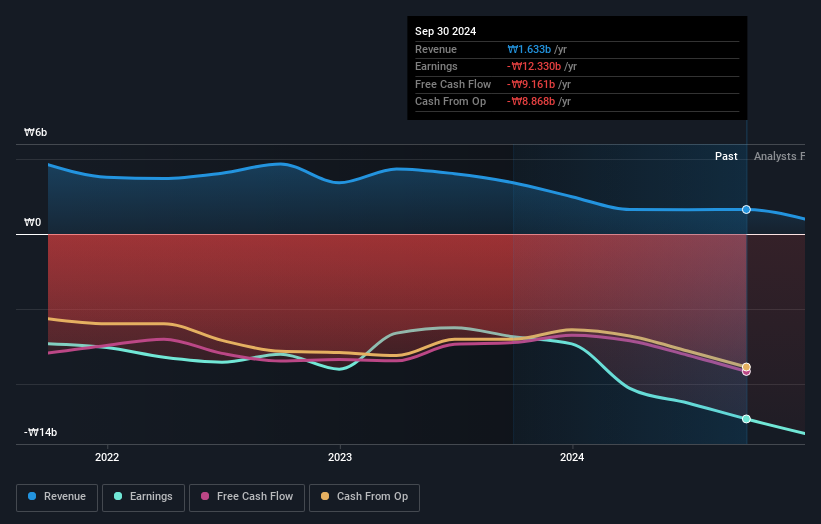
JLKInc's revenue didn't grow at all in the last year. In fact, it fell 52%. That looks like a train-wreck result to investors far and wide. It's no surprise, then, that investors dumped the stock like it was garbage, sending the share price down 63%. Buying shares in companies that lose money, shrink revenue, and see share price declines is unpopular with investors, but popular with speculators (apparently). This company will really need to improve on the numbers before we get excited about it.
You can see below how earnings and revenue have changed over time (discover the exact values by clicking on the image).

Balance sheet strength is crucial. It might be well worthwhile taking a look at our free report on how its financial position has changed over time.
What About The Total Shareholder Return (TSR)?
Investors should note that there's a difference between JLKInc's total shareholder return (TSR) and its share price change, which we've covered above. The TSR is a return calculation that accounts for the value of cash dividends (assuming that any dividend received was reinvested) and the calculated value of any discounted capital raisings and spin-offs. We note that JLKInc's TSR, at -60% is higher than its share price return of -63%. When you consider it hasn't been paying a dividend, this data suggests shareholders have benefitted from a spin-off, or had the opportunity to acquire attractively priced shares in a discounted capital raising.
A Different Perspective
We regret to report that JLKInc shareholders are down 60% for the year. Unfortunately, that's worse than the broader market decline of 0.8%. Having said that, it's inevitable that some stocks will be oversold in a falling market. The key is to keep your eyes on the fundamental developments. On the bright side, long term shareholders have made money, with a gain of 0.6% per year over half a decade. It could be that the recent sell-off is an opportunity, so it may be worth checking the fundamental data for signs of a long term growth trend. I find it very interesting to look at share price over the long term as a proxy for business performance. But to truly gain insight, we need to consider other information, too. For instance, we've identified 3 warning signs for JLKInc that you should be aware of.
But note: JLKInc may not be the best stock to buy. So take a peek at this free list of interesting companies with past earnings growth (and further growth forecast).
Please note, the market returns quoted in this article reflect the market weighted average returns of stocks that currently trade on South Korean exchanges.
New: Manage All Your Stock Portfolios in One Place
We've created the ultimate portfolio companion for stock investors, and it's free.
• Connect an unlimited number of Portfolios and see your total in one currency
• Be alerted to new Warning Signs or Risks via email or mobile
• Track the Fair Value of your stocks
Have feedback on this article? Concerned about the content? Get in touch with us directly. Alternatively, email editorial-team (at) simplywallst.com.
This article by Simply Wall St is general in nature. We provide commentary based on historical data and analyst forecasts only using an unbiased methodology and our articles are not intended to be financial advice. It does not constitute a recommendation to buy or sell any stock, and does not take account of your objectives, or your financial situation. We aim to bring you long-term focused analysis driven by fundamental data. Note that our analysis may not factor in the latest price-sensitive company announcements or qualitative material. Simply Wall St has no position in any stocks mentioned.
About KOSDAQ:A322510
JLKInc
JLK, Inc. provides diagnosis support to the patients with it AI-driven solutions in South Korea.
Low with imperfect balance sheet.
Market Insights
Community Narratives


