- South Korea
- /
- Medical Equipment
- /
- KOSDAQ:A028300
While HLB (KOSDAQ:028300) shareholders have made 222% in 3 years, increasing losses might now be front of mind as stock sheds 3.9% this week


The worst result, after buying shares in a company (assuming no leverage), would be if you lose all the money you put in. But in contrast you can make much more than 100% if the company does well. For example, the HLB Co., Ltd. (KOSDAQ:028300) share price has soared 212% in the last three years. That sort of return is as solid as granite. Also pleasing for shareholders was the 19% gain in the last three months.
Although HLB has shed ₩459b from its market cap this week, let's take a look at its longer term fundamental trends and see if they've driven returns.
View our latest analysis for HLB
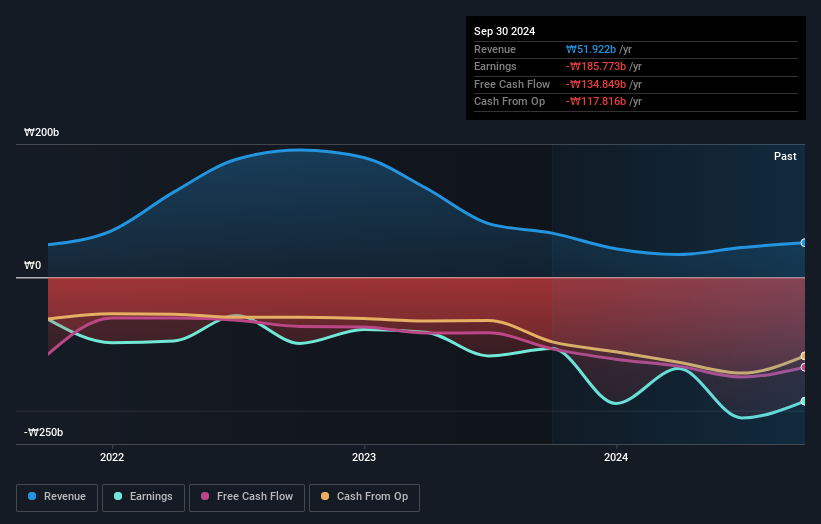
HLB wasn't profitable in the last twelve months, it is unlikely we'll see a strong correlation between its share price and its earnings per share (EPS). Arguably revenue is our next best option. When a company doesn't make profits, we'd generally hope to see good revenue growth. That's because fast revenue growth can be easily extrapolated to forecast profits, often of considerable size.
In the last 3 years HLB saw its revenue shrink by 28% per year. So we wouldn't have expected the share price to gain 46% per year, but it has. It's fair to say shareholders are definitely counting on a bright future.
You can see below how earnings and revenue have changed over time (discover the exact values by clicking on the image).
This free interactive report on HLB's balance sheet strength is a great place to start, if you want to investigate the stock further.
What About The Total Shareholder Return (TSR)?
We'd be remiss not to mention the difference between HLB's total shareholder return (TSR) and its share price return. The TSR attempts to capture the value of dividends (as if they were reinvested) as well as any spin-offs or discounted capital raisings offered to shareholders. We note that HLB's TSR, at 222% is higher than its share price return of 212%. When you consider it hasn't been paying a dividend, this data suggests shareholders have benefitted from a spin-off, or had the opportunity to acquire attractively priced shares in a discounted capital raising.
A Different Perspective
We regret to report that HLB shareholders are down 12% for the year. Unfortunately, that's worse than the broader market decline of 5.0%. However, it could simply be that the share price has been impacted by broader market jitters. It might be worth keeping an eye on the fundamentals, in case there's a good opportunity. Longer term investors wouldn't be so upset, since they would have made 22%, each year, over five years. It could be that the recent sell-off is an opportunity, so it may be worth checking the fundamental data for signs of a long term growth trend. It's always interesting to track share price performance over the longer term. But to understand HLB better, we need to consider many other factors. Consider for instance, the ever-present spectre of investment risk. We've identified 1 warning sign with HLB , and understanding them should be part of your investment process.
We will like HLB better if we see some big insider buys. While we wait, check out this free list of undervalued stocks (mostly small caps) with considerable, recent, insider buying.
Please note, the market returns quoted in this article reflect the market weighted average returns of stocks that currently trade on South Korean exchanges.
If you're looking to trade HLB, open an account with the lowest-cost platform trusted by professionals, Interactive Brokers.
With clients in over 200 countries and territories, and access to 160 markets, IBKR lets you trade stocks, options, futures, forex, bonds and funds from a single integrated account.
Enjoy no hidden fees, no account minimums, and FX conversion rates as low as 0.03%, far better than what most brokers offer.
Sponsored ContentValuation is complex, but we're here to simplify it.
Discover if HLB might be undervalued or overvalued with our detailed analysis, featuring fair value estimates, potential risks, dividends, insider trades, and its financial condition.
Access Free AnalysisHave feedback on this article? Concerned about the content? Get in touch with us directly. Alternatively, email editorial-team (at) simplywallst.com.
This article by Simply Wall St is general in nature. We provide commentary based on historical data and analyst forecasts only using an unbiased methodology and our articles are not intended to be financial advice. It does not constitute a recommendation to buy or sell any stock, and does not take account of your objectives, or your financial situation. We aim to bring you long-term focused analysis driven by fundamental data. Note that our analysis may not factor in the latest price-sensitive company announcements or qualitative material. Simply Wall St has no position in any stocks mentioned.
About KOSDAQ:A028300
HLB
Manufactures and constructs lifeboats and glass fiber pipes in South Korea and internationally.
Adequate balance sheet low.
Market Insights

Community Narratives

