- South Korea
- /
- Capital Markets
- /
- KOSDAQ:A027360
Subdued Growth No Barrier To Aju IB Investment Co., Ltd. (KOSDAQ:027360) With Shares Advancing 46%


Aju IB Investment Co., Ltd. (KOSDAQ:027360) shares have continued their recent momentum with a 46% gain in the last month alone. The annual gain comes to 224% following the latest surge, making investors sit up and take notice.
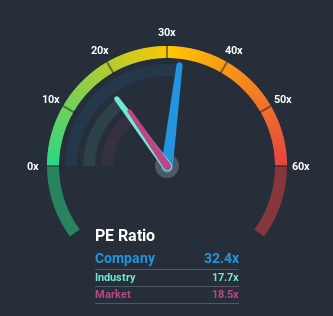
Since its price has surged higher, Aju IB Investment's price-to-earnings (or "P/E") ratio of 32.4x might make it look like a strong sell right now compared to the market in Korea, where around half of the companies have P/E ratios below 18x and even P/E's below 9x are quite common. However, the P/E might be quite high for a reason and it requires further investigation to determine if it's justified.
Recent times have been quite advantageous for Aju IB Investment as its earnings have been rising very briskly. It seems that many are expecting the strong earnings performance to beat most other companies over the coming period, which has increased investors’ willingness to pay up for the stock. You'd really hope so, otherwise you're paying a pretty hefty price for no particular reason.
See our latest analysis for Aju IB Investment
What Are Growth Metrics Telling Us About The High P/E?
In order to justify its P/E ratio, Aju IB Investment would need to produce outstanding growth well in excess of the market.
Retrospectively, the last year delivered an exceptional 42% gain to the company's bottom line. The latest three year period has also seen a 5.9% overall rise in EPS, aided extensively by its short-term performance. Therefore, it's fair to say the earnings growth recently has been respectable for the company.
Weighing that recent medium-term earnings trajectory against the broader market's one-year forecast for expansion of 40% shows it's noticeably less attractive on an annualised basis.
In light of this, it's alarming that Aju IB Investment's P/E sits above the majority of other companies. It seems most investors are ignoring the fairly limited recent growth rates and are hoping for a turnaround in the company's business prospects. Only the boldest would assume these prices are sustainable as a continuation of recent earnings trends is likely to weigh heavily on the share price eventually.
The Key Takeaway
The strong share price surge has got Aju IB Investment's P/E rushing to great heights as well. Generally, our preference is to limit the use of the price-to-earnings ratio to establishing what the market thinks about the overall health of a company.
We've established that Aju IB Investment currently trades on a much higher than expected P/E since its recent three-year growth is lower than the wider market forecast. When we see weak earnings with slower than market growth, we suspect the share price is at risk of declining, sending the high P/E lower. If recent medium-term earnings trends continue, it will place shareholders' investments at significant risk and potential investors in danger of paying an excessive premium.
It is also worth noting that we have found 3 warning signs for Aju IB Investment that you need to take into consideration.
Of course, you might also be able to find a better stock than Aju IB Investment. So you may wish to see this free collection of other companies that sit on P/E's below 20x and have grown earnings strongly.
If you decide to trade Aju IB Investment, use the lowest-cost* platform that is rated #1 Overall by Barron’s, Interactive Brokers. Trade stocks, options, futures, forex, bonds and funds on 135 markets, all from a single integrated account. Promoted
New: Manage All Your Stock Portfolios in One Place
We've created the ultimate portfolio companion for stock investors, and it's free.
• Connect an unlimited number of Portfolios and see your total in one currency
• Be alerted to new Warning Signs or Risks via email or mobile
• Track the Fair Value of your stocks
This article by Simply Wall St is general in nature. It does not constitute a recommendation to buy or sell any stock, and does not take account of your objectives, or your financial situation. We aim to bring you long-term focused analysis driven by fundamental data. Note that our analysis may not factor in the latest price-sensitive company announcements or qualitative material. Simply Wall St has no position in any stocks mentioned.
*Interactive Brokers Rated Lowest Cost Broker by StockBrokers.com Annual Online Review 2020
Have feedback on this article? Concerned about the content? Get in touch with us directly. Alternatively, email editorial-team@simplywallst.com.
About KOSDAQ:A027360
AJU IB INVESTMENT
A venture capital and private equity arm of AJU Corporation Co., Ltd.
Excellent balance sheet slight.
Market Insights

Community Narratives

