- South Korea
- /
- Diversified Financial
- /
- KOSDAQ:A021880
Market Participants Recognise Mason Capital Corporation's (KOSDAQ:021880) Revenues Pushing Shares 30% Higher


Mason Capital Corporation (KOSDAQ:021880) shareholders have had their patience rewarded with a 30% share price jump in the last month. The last 30 days bring the annual gain to a very sharp 45%.
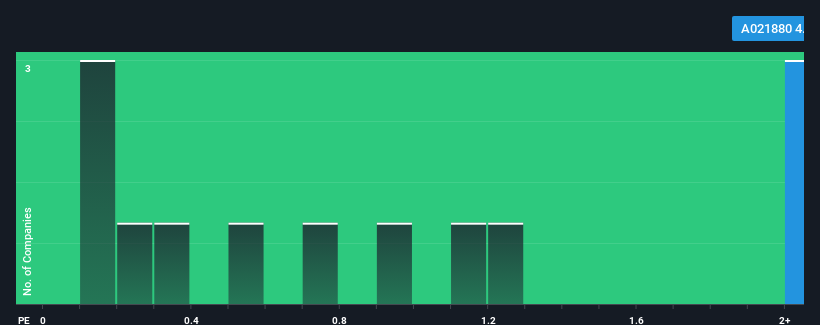
After such a large jump in price, when almost half of the companies in Korea's Diversified Financial industry have price-to-sales ratios (or "P/S") below 0.7x, you may consider Mason Capital as a stock not worth researching with its 4.2x P/S ratio. Although, it's not wise to just take the P/S at face value as there may be an explanation why it's so lofty.
View our latest analysis for Mason Capital
How Mason Capital Has Been Performing
Mason Capital certainly has been doing a great job lately as it's been growing its revenue at a really rapid pace. It seems that many are expecting the strong revenue performance to beat most other companies over the coming period, which has increased investors’ willingness to pay up for the stock. However, if this isn't the case, investors might get caught out paying too much for the stock.
Although there are no analyst estimates available for Mason Capital, take a look at this free data-rich visualisation to see how the company stacks up on earnings, revenue and cash flow.Do Revenue Forecasts Match The High P/S Ratio?
Mason Capital's P/S ratio would be typical for a company that's expected to deliver very strong growth, and importantly, perform much better than the industry.
Taking a look back first, we see that the company's revenues underwent some rampant growth over the last 12 months. The latest three year period has also seen an excellent 223% overall rise in revenue, aided by its incredible short-term performance. Accordingly, shareholders would have definitely welcomed those medium-term rates of revenue growth.
Comparing that to the industry, which is predicted to shrink 53% in the next 12 months, the company's positive momentum based on recent medium-term revenue results is a bright spot for the moment.
In light of this, it's understandable that Mason Capital's P/S sits above the majority of other companies. Investors are willing to pay more for a stock they hope will buck the trend of the broader industry going backwards. However, its current revenue trajectory will be very difficult to maintain against the headwinds other companies are facing at the moment.
What We Can Learn From Mason Capital's P/S?
The strong share price surge has lead to Mason Capital's P/S soaring as well. We'd say the price-to-sales ratio's power isn't primarily as a valuation instrument but rather to gauge current investor sentiment and future expectations.
As detailed previously, the strength of Mason Capital's recent revenue trends over the medium-term relative to a declining industry is part of the reason why it trades at a higher P/S than its industry counterparts. It could be said that investors feel this revenue growth will continue into the future, justifying a higher P/S ratio. We still remain cautious about the company's ability to stay its recent course and swim against the current of the broader industry turmoil. Although, if the company's relative performance doesn't change it will continue to provide strong support to the share price.
You should always think about risks. Case in point, we've spotted 2 warning signs for Mason Capital you should be aware of.
If you're unsure about the strength of Mason Capital's business, why not explore our interactive list of stocks with solid business fundamentals for some other companies you may have missed.
New: Manage All Your Stock Portfolios in One Place
We've created the ultimate portfolio companion for stock investors, and it's free.
• Connect an unlimited number of Portfolios and see your total in one currency
• Be alerted to new Warning Signs or Risks via email or mobile
• Track the Fair Value of your stocks
Have feedback on this article? Concerned about the content? Get in touch with us directly. Alternatively, email editorial-team (at) simplywallst.com.
This article by Simply Wall St is general in nature. We provide commentary based on historical data and analyst forecasts only using an unbiased methodology and our articles are not intended to be financial advice. It does not constitute a recommendation to buy or sell any stock, and does not take account of your objectives, or your financial situation. We aim to bring you long-term focused analysis driven by fundamental data. Note that our analysis may not factor in the latest price-sensitive company announcements or qualitative material. Simply Wall St has no position in any stocks mentioned.
About KOSDAQ:A021880
Flawless balance sheet and overvalued.
Market Insights

Community Narratives

