- South Korea
- /
- Consumer Durables
- /
- KOSE:A021240
Is COWAY Co., Ltd. (KRX:021240) Trading At A 47% Discount?


Key Insights
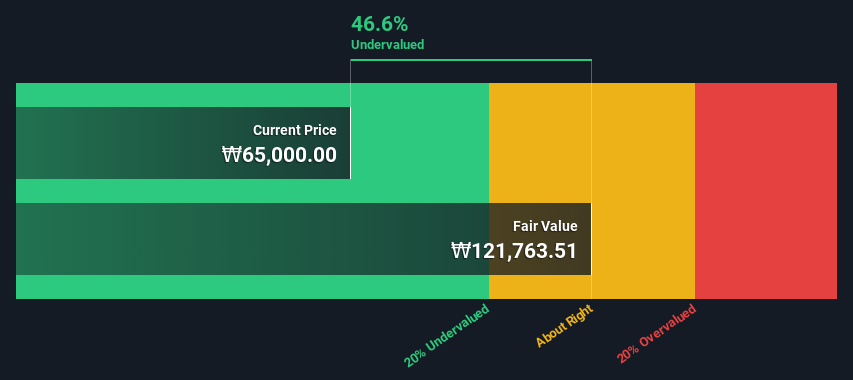
- The projected fair value for COWAY is ₩121,764 based on 2 Stage Free Cash Flow to Equity
- COWAY's ₩65,000 share price signals that it might be 47% undervalued
- Analyst price target for A021240 is ₩69,900 which is 43% below our fair value estimate
In this article we are going to estimate the intrinsic value of COWAY Co., Ltd. (KRX:021240) by projecting its future cash flows and then discounting them to today's value. We will take advantage of the Discounted Cash Flow (DCF) model for this purpose. Don't get put off by the jargon, the math behind it is actually quite straightforward.
We generally believe that a company's value is the present value of all of the cash it will generate in the future. However, a DCF is just one valuation metric among many, and it is not without flaws. Anyone interested in learning a bit more about intrinsic value should have a read of the Simply Wall St analysis model.
See our latest analysis for COWAY
Crunching The Numbers
We are going to use a two-stage DCF model, which, as the name states, takes into account two stages of growth. The first stage is generally a higher growth period which levels off heading towards the terminal value, captured in the second 'steady growth' period. In the first stage we need to estimate the cash flows to the business over the next ten years. Where possible we use analyst estimates, but when these aren't available we extrapolate the previous free cash flow (FCF) from the last estimate or reported value. We assume companies with shrinking free cash flow will slow their rate of shrinkage, and that companies with growing free cash flow will see their growth rate slow, over this period. We do this to reflect that growth tends to slow more in the early years than it does in later years.
A DCF is all about the idea that a dollar in the future is less valuable than a dollar today, and so the sum of these future cash flows is then discounted to today's value:
10-year free cash flow (FCF) forecast
| 2025 | 2026 | 2027 | 2028 | 2029 | 2030 | 2031 | 2032 | 2033 | 2034 | |
| Levered FCF (₩, Millions) | ₩668.6b | ₩687.7b | ₩705.3b | ₩723.1b | ₩741.3b | ₩759.9b | ₩778.9b | ₩798.3b | ₩818.2b | ₩838.5b |
| Growth Rate Estimate Source | Analyst x5 | Analyst x4 | Est @ 2.56% | Est @ 2.53% | Est @ 2.52% | Est @ 2.51% | Est @ 2.50% | Est @ 2.49% | Est @ 2.49% | Est @ 2.49% |
| Present Value (₩, Millions) Discounted @ 10% | ₩607.3k | ₩567.4k | ₩528.6k | ₩492.4k | ₩458.5k | ₩426.9k | ₩397.5k | ₩370.1k | ₩344.5k | ₩320.8k |
("Est" = FCF growth rate estimated by Simply Wall St)
Present Value of 10-year Cash Flow (PVCF) = ₩4.5t
The second stage is also known as Terminal Value, this is the business's cash flow after the first stage. The Gordon Growth formula is used to calculate Terminal Value at a future annual growth rate equal to the 5-year average of the 10-year government bond yield of 2.5%. We discount the terminal cash flows to today's value at a cost of equity of 10%.
Terminal Value (TV)= FCF2034 × (1 + g) ÷ (r – g) = ₩839b× (1 + 2.5%) ÷ (10%– 2.5%) = ₩11t
Present Value of Terminal Value (PVTV)= TV / (1 + r)10= ₩11t÷ ( 1 + 10%)10= ₩4.3t
The total value, or equity value, is then the sum of the present value of the future cash flows, which in this case is ₩8.8t. The last step is to then divide the equity value by the number of shares outstanding. Compared to the current share price of ₩65k, the company appears quite undervalued at a 47% discount to where the stock price trades currently. Remember though, that this is just an approximate valuation, and like any complex formula - garbage in, garbage out.
Important Assumptions
We would point out that the most important inputs to a discounted cash flow are the discount rate and of course the actual cash flows. You don't have to agree with these inputs, I recommend redoing the calculations yourself and playing with them. The DCF also does not consider the possible cyclicality of an industry, or a company's future capital requirements, so it does not give a full picture of a company's potential performance. Given that we are looking at COWAY as potential shareholders, the cost of equity is used as the discount rate, rather than the cost of capital (or weighted average cost of capital, WACC) which accounts for debt. In this calculation we've used 10%, which is based on a levered beta of 1.430. Beta is a measure of a stock's volatility, compared to the market as a whole. We get our beta from the industry average beta of globally comparable companies, with an imposed limit between 0.8 and 2.0, which is a reasonable range for a stable business.
SWOT Analysis for COWAY
- Debt is not viewed as a risk.
- Dividends are covered by earnings and cash flows.
- Earnings growth over the past year underperformed the Consumer Durables industry.
- Dividend is low compared to the top 25% of dividend payers in the Consumer Durables market.
- Annual earnings are forecast to grow for the next 3 years.
- Trading below our estimate of fair value by more than 20%.
- Annual earnings are forecast to grow slower than the South Korean market.
Next Steps:
Although the valuation of a company is important, it ideally won't be the sole piece of analysis you scrutinize for a company. It's not possible to obtain a foolproof valuation with a DCF model. Preferably you'd apply different cases and assumptions and see how they would impact the company's valuation. If a company grows at a different rate, or if its cost of equity or risk free rate changes sharply, the output can look very different. Can we work out why the company is trading at a discount to intrinsic value? For COWAY, there are three essential elements you should further research:
- Risks: We feel that you should assess the 1 warning sign for COWAY we've flagged before making an investment in the company.
- Future Earnings: How does A021240's growth rate compare to its peers and the wider market? Dig deeper into the analyst consensus number for the upcoming years by interacting with our free analyst growth expectation chart.
- Other Solid Businesses: Low debt, high returns on equity and good past performance are fundamental to a strong business. Why not explore our interactive list of stocks with solid business fundamentals to see if there are other companies you may not have considered!
PS. Simply Wall St updates its DCF calculation for every South Korean stock every day, so if you want to find the intrinsic value of any other stock just search here.
New: AI Stock Screener & Alerts
Our new AI Stock Screener scans the market every day to uncover opportunities.
• Dividend Powerhouses (3%+ Yield)
• Undervalued Small Caps with Insider Buying
• High growth Tech and AI Companies
Or build your own from over 50 metrics.
Have feedback on this article? Concerned about the content? Get in touch with us directly. Alternatively, email editorial-team (at) simplywallst.com.
This article by Simply Wall St is general in nature. We provide commentary based on historical data and analyst forecasts only using an unbiased methodology and our articles are not intended to be financial advice. It does not constitute a recommendation to buy or sell any stock, and does not take account of your objectives, or your financial situation. We aim to bring you long-term focused analysis driven by fundamental data. Note that our analysis may not factor in the latest price-sensitive company announcements or qualitative material. Simply Wall St has no position in any stocks mentioned.
Have feedback on this article? Concerned about the content? Get in touch with us directly. Alternatively, email editorial-team@simplywallst.com
About KOSE:A021240
COWAY
Engages in the production and sale of environmental home appliances in South Korea and internationally.
Solid track record with excellent balance sheet.
Similar Companies
Market Insights

Community Narratives

