
Advertisement
- South Korea
- /
- Luxury
- /
- KOSE:A011300
Subdued Growth No Barrier To Seong An Materials Co.,Ltd (KRX:011300) With Shares Advancing 28%
Seong An Materials Co.,Ltd (KRX:011300) shareholders would be excited to see that the share price has had a great month, posting a 28% gain and recovering from prior weakness. Taking a wider view, although not as strong as the last month, the full year gain of 24% is also fairly reasonable.
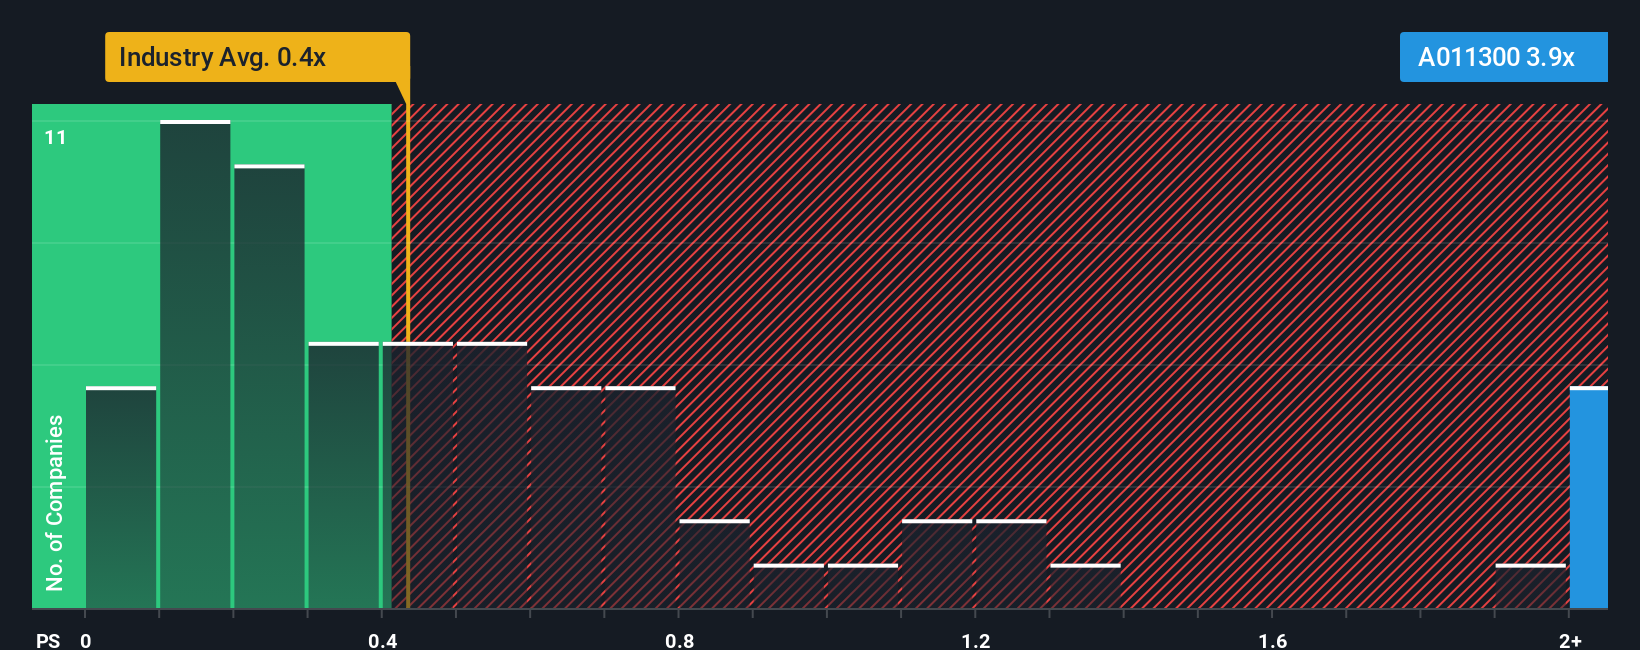
Since its price has surged higher, when almost half of the companies in Korea's Luxury industry have price-to-sales ratios (or "P/S") below 0.4x, you may consider Seong An MaterialsLtd as a stock not worth researching with its 3.9x P/S ratio. However, the P/S might be quite high for a reason and it requires further investigation to determine if it's justified.
Check out our latest analysis for Seong An MaterialsLtd
What Does Seong An MaterialsLtd's P/S Mean For Shareholders?
For example, consider that Seong An MaterialsLtd's financial performance has been poor lately as its revenue has been in decline. Perhaps the market believes the company can do enough to outperform the rest of the industry in the near future, which is keeping the P/S ratio high. However, if this isn't the case, investors might get caught out paying too much for the stock.
We don't have analyst forecasts, but you can see how recent trends are setting up the company for the future by checking out our free report on Seong An MaterialsLtd's earnings, revenue and cash flow.How Is Seong An MaterialsLtd's Revenue Growth Trending?
Seong An MaterialsLtd's P/S ratio would be typical for a company that's expected to deliver very strong growth, and importantly, perform much better than the industry.
In reviewing the last year of financials, we were disheartened to see the company's revenues fell to the tune of 20%. The last three years don't look nice either as the company has shrunk revenue by 69% in aggregate. Accordingly, shareholders would have felt downbeat about the medium-term rates of revenue growth.
Comparing that to the industry, which is predicted to shrink 1.9% in the next 12 months, the company's downward momentum is still inferior based on recent medium-term annualised revenue results.
In light of this, it's odd that Seong An MaterialsLtd's P/S sits above the majority of other companies. With revenue going quickly in reverse, it's not guaranteed that the P/S has found a floor yet. Maintaining these prices will be extremely difficult to achieve as a continuation of recent revenue trends is likely to weigh down the shares eventually.
The Bottom Line On Seong An MaterialsLtd's P/S
Shares in Seong An MaterialsLtd have seen a strong upwards swing lately, which has really helped boost its P/S figure. Using the price-to-sales ratio alone to determine if you should sell your stock isn't sensible, however it can be a practical guide to the company's future prospects.
We've established that Seong An MaterialsLtd currently trades on a much higher than expected P/S since its recent three-year revenues are even worse than the forecasts for a struggling industry. When we see below average revenue, we suspect the share price is at risk of declining, sending the high P/S lower. We're also cautious about the company's ability to stay its recent medium-term course and resist even greater pain to its business from the broader industry turmoil. Unless the company's relative performance improves markedly, it's very challenging to accept these prices as being reasonable.
Before you settle on your opinion, we've discovered 5 warning signs for Seong An MaterialsLtd (4 make us uncomfortable!) that you should be aware of.
If these risks are making you reconsider your opinion on Seong An MaterialsLtd, explore our interactive list of high quality stocks to get an idea of what else is out there.
New: Manage All Your Stock Portfolios in One Place
We've created the ultimate portfolio companion for stock investors, and it's free.
• Connect an unlimited number of Portfolios and see your total in one currency
• Be alerted to new Warning Signs or Risks via email or mobile
• Track the Fair Value of your stocks
Have feedback on this article? Concerned about the content? Get in touch with us directly. Alternatively, email editorial-team (at) simplywallst.com.
This article by Simply Wall St is general in nature. We provide commentary based on historical data and analyst forecasts only using an unbiased methodology and our articles are not intended to be financial advice. It does not constitute a recommendation to buy or sell any stock, and does not take account of your objectives, or your financial situation. We aim to bring you long-term focused analysis driven by fundamental data. Note that our analysis may not factor in the latest price-sensitive company announcements or qualitative material. Simply Wall St has no position in any stocks mentioned.
About KOSE:A011300
Seong An MaterialsLtd
A textile company, manufactures, exports, and sells fabric related products in Korea and internationally.
Adequate balance sheet with slight risk.
Market Insights

Advertisement
Weekly Picks
RO


RockeTeller on Santacruz Silver Mining ·
Crazy Undervalued 42 Baggers Silver Play (Active & Running Mine)
Fair Value:CA$8696.4% undervalued
41 followersusers have followed this narrative
6 commentsusers have commented on this narrative
13 likesusers have liked this narrative
RO


Robbo on Fiducian Group ·
Fiducian: Compliance Clouds or Value Opportunity?
Fair Value:AU$123.8% undervalued
4 followersusers have followed this narrative
0 commentsusers have commented on this narrative
0 likesusers have liked this narrative
WO

woodworthfund on Willamette Valley Vineyards ·
Willamette Valley Vineyards (WVVI): Not-So-Great Value
Fair Value:US$244.5% overvalued
6 followersusers have followed this narrative
0 commentsusers have commented on this narrative
1 likeusers have liked this narrative
Recently Updated Narratives
SC

scm on Text ·
TXT will see revenue grow 26% with a profit margin boost of almost 40%
Fair Value:zł8048.3% undervalued
1 followerusers have followed this narrative
0 commentsusers have commented on this narrative
0 likesusers have liked this narrative
VL

Vladislav on Galleon Gold ·
Significantly undervalued gold explorer in Timmins, finally getting traction
Fair Value:CA$482.9% undervalued
1 followerusers have followed this narrative
0 commentsusers have commented on this narrative
0 likesusers have liked this narrative
FU

FundamentallySarcastic on Credit Corp Group ·
Moderation and Stabilisation: HOLD: Fair Price based on a 4-year Cycle is $12.08
Fair Value:AU$12.6411.8% overvalued
3 followersusers have followed this narrative
0 commentsusers have commented on this narrative
0 likesusers have liked this narrative
Popular Narratives
TH


TheWallstreetKing on MicroVision ·
MicroVision will explode future revenue by 380.37% with a vision towards success
Fair Value:US$6098.5% undervalued
115 followersusers have followed this narrative
11 commentsusers have commented on this narrative
22 likesusers have liked this narrative
AN


AnalystConsensusTarget on NVIDIA ·
NVDA: Expanding AI Demand Will Drive Major Data Center Investments Through 2026
Fair Value:US$250.3928.3% undervalued
954 followersusers have followed this narrative
6 commentsusers have commented on this narrative
25 likesusers have liked this narrative
OS


oscargarcia on Alphabet ·
The company that turned a verb into a global necessity and basically runs the modern internet, digital ads, smartphones, maps, and AI.
Fair Value:US$3406.0% undervalued
147 followersusers have followed this narrative
6 commentsusers have commented on this narrative
18 likesusers have liked this narrative

