- South Korea
- /
- Luxury
- /
- KOSE:A001530
Despite lower earnings than five years ago, Di Dong Il (KRX:001530) investors are up 715% since then


While Di Dong Il Corporation (KRX:001530) shareholders are probably generally happy, the stock hasn't had particularly good run recently, with the share price falling 18% in the last quarter. But over five years returns have been remarkably great. In fact, during that period, the share price climbed 678%. Impressive! Arguably, the recent fall is to be expected after such a strong rise. Of course what matters most is whether the business can improve itself sustainably, thus justifying a higher price. We love happy stories like this one. The company should be really proud of that performance!
Although Di Dong Il has shed ₩134b from its market cap this week, let's take a look at its longer term fundamental trends and see if they've driven returns.
While markets are a powerful pricing mechanism, share prices reflect investor sentiment, not just underlying business performance. By comparing earnings per share (EPS) and share price changes over time, we can get a feel for how investor attitudes to a company have morphed over time.
Di Dong Il's earnings per share are down 32% per year, despite strong share price performance over five years.
This means it's unlikely the market is judging the company based on earnings growth. Since the change in EPS doesn't seem to correlate with the change in share price, it's worth taking a look at other metrics.
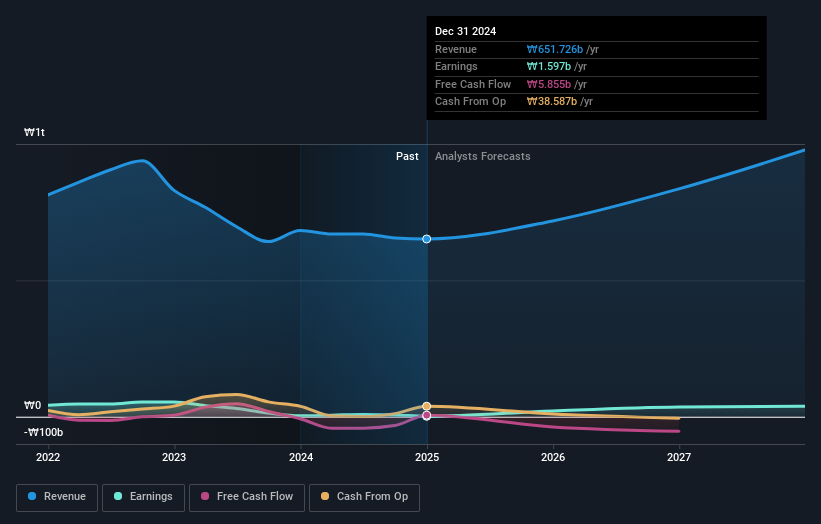
We doubt the modest 0.6% dividend yield is attracting many buyers to the stock. The revenue growth of 1.5% per year hardly seems impressive. So it seems one might have to take closer look at earnings and revenue trends to see how they might influence the share price.
The graphic below depicts how earnings and revenue have changed over time (unveil the exact values by clicking on the image).
Balance sheet strength is crucial. It might be well worthwhile taking a look at our free report on how its financial position has changed over time .
What About Dividends?
When looking at investment returns, it is important to consider the difference between total shareholder return (TSR) and share price return. Whereas the share price return only reflects the change in the share price, the TSR includes the value of dividends (assuming they were reinvested) and the benefit of any discounted capital raising or spin-off. Arguably, the TSR gives a more comprehensive picture of the return generated by a stock. We note that for Di Dong Il the TSR over the last 5 years was 715%, which is better than the share price return mentioned above. This is largely a result of its dividend payments!
A Different Perspective
It's nice to see that Di Dong Il shareholders have received a total shareholder return of 57% over the last year. And that does include the dividend. That's better than the annualised return of 52% over half a decade, implying that the company is doing better recently. Given the share price momentum remains strong, it might be worth taking a closer look at the stock, lest you miss an opportunity. I find it very interesting to look at share price over the long term as a proxy for business performance. But to truly gain insight, we need to consider other information, too. Case in point: We've spotted 2 warning signs for Di Dong Il you should be aware of, and 1 of them is potentially serious.
Of course, you might find a fantastic investment by looking elsewhere. So take a peek at this free list of companies we expect will grow earnings.
Please note, the market returns quoted in this article reflect the market weighted average returns of stocks that currently trade on South Korean exchanges.
New: Manage All Your Stock Portfolios in One Place
We've created the ultimate portfolio companion for stock investors, and it's free.
• Connect an unlimited number of Portfolios and see your total in one currency
• Be alerted to new Warning Signs or Risks via email or mobile
• Track the Fair Value of your stocks
Have feedback on this article? Concerned about the content? Get in touch with us directly. Alternatively, email editorial-team (at) simplywallst.com.
This article by Simply Wall St is general in nature. We provide commentary based on historical data and analyst forecasts only using an unbiased methodology and our articles are not intended to be financial advice. It does not constitute a recommendation to buy or sell any stock, and does not take account of your objectives, or your financial situation. We aim to bring you long-term focused analysis driven by fundamental data. Note that our analysis may not factor in the latest price-sensitive company announcements or qualitative material. Simply Wall St has no position in any stocks mentioned.
About KOSE:A001530
Di Dong Il
Operates in the textile and clothing industries in South Korea and internationally.
Reasonable growth potential very low.
Market Insights

Community Narratives

