
Advertisement
- South Korea
- /
- Consumer Durables
- /
- KOSDAQ:A376180
Picogram.co.Ltd's (KOSDAQ:376180) Returns On Capital Tell Us There Is Reason To Feel Uneasy
When researching a stock for investment, what can tell us that the company is in decline? Typically, we'll see the trend of both return on capital employed (ROCE) declining and this usually coincides with a decreasing amount of capital employed. Trends like this ultimately mean the business is reducing its investments and also earning less on what it has invested. And from a first read, things don't look too good at Picogram.co.Ltd (KOSDAQ:376180), so let's see why.
What Is Return On Capital Employed (ROCE)?
For those who don't know, ROCE is a measure of a company's yearly pre-tax profit (its return), relative to the capital employed in the business. The formula for this calculation on Picogram.co.Ltd is:
Return on Capital Employed = Earnings Before Interest and Tax (EBIT) ÷ (Total Assets - Current Liabilities)
0.034 = ₩1.1b ÷ (₩74b - ₩42b) (Based on the trailing twelve months to September 2023).
Therefore, Picogram.co.Ltd has an ROCE of 3.4%. Ultimately, that's a low return and it under-performs the Consumer Durables industry average of 6.0%.
Check out our latest analysis for Picogram.co.Ltd
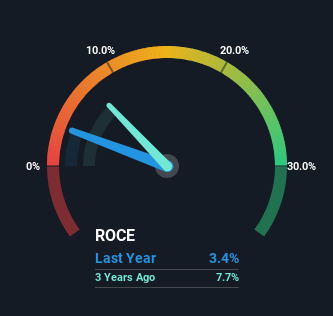
Historical performance is a great place to start when researching a stock so above you can see the gauge for Picogram.co.Ltd's ROCE against it's prior returns. If you're interested in investigating Picogram.co.Ltd's past further, check out this free graph covering Picogram.co.Ltd's past earnings, revenue and cash flow.
What The Trend Of ROCE Can Tell Us
We are a bit worried about the trend of returns on capital at Picogram.co.Ltd. Unfortunately the returns on capital have diminished from the 7.7% that they were earning three years ago. Meanwhile, capital employed in the business has stayed roughly the flat over the period. Companies that exhibit these attributes tend to not be shrinking, but they can be mature and facing pressure on their margins from competition. So because these trends aren't typically conducive to creating a multi-bagger, we wouldn't hold our breath on Picogram.co.Ltd becoming one if things continue as they have.
While on the subject, we noticed that the ratio of current liabilities to total assets has risen to 56%, which has impacted the ROCE. If current liabilities hadn't increased as much as they did, the ROCE could actually be even lower. What this means is that in reality, a rather large portion of the business is being funded by the likes of the company's suppliers or short-term creditors, which can bring some risks of its own.
The Key Takeaway
In summary, it's unfortunate that Picogram.co.Ltd is generating lower returns from the same amount of capital. Long term shareholders who've owned the stock over the last year have experienced a 61% depreciation in their investment, so it appears the market might not like these trends either. With underlying trends that aren't great in these areas, we'd consider looking elsewhere.
If you'd like to know about the risks facing Picogram.co.Ltd, we've discovered 4 warning signs that you should be aware of.
For those who like to invest in solid companies, check out this free list of companies with solid balance sheets and high returns on equity.
New: Manage All Your Stock Portfolios in One Place
We've created the ultimate portfolio companion for stock investors, and it's free.
• Connect an unlimited number of Portfolios and see your total in one currency
• Be alerted to new Warning Signs or Risks via email or mobile
• Track the Fair Value of your stocks
Have feedback on this article? Concerned about the content? Get in touch with us directly. Alternatively, email editorial-team (at) simplywallst.com.
This article by Simply Wall St is general in nature. We provide commentary based on historical data and analyst forecasts only using an unbiased methodology and our articles are not intended to be financial advice. It does not constitute a recommendation to buy or sell any stock, and does not take account of your objectives, or your financial situation. We aim to bring you long-term focused analysis driven by fundamental data. Note that our analysis may not factor in the latest price-sensitive company announcements or qualitative material. Simply Wall St has no position in any stocks mentioned.
Have feedback on this article? Concerned about the content? Get in touch with us directly. Alternatively, email editorial-team@simplywallst.com
About KOSDAQ:A376180
Picogram.co.Ltd
Provides environment home appliance products in Korea, Europe, Asia, the United States.
Unattractive dividend payer with very low risk.
Market Insights

Advertisement
Weekly Picks
RO


RockeTeller on Santacruz Silver Mining ·
Crazy Undervalued 42 Baggers Silver Play (Active & Running Mine)
Fair Value:CA$8696.7% undervalued
24 followersusers have followed this narrative
6 commentsusers have commented on this narrative
7 likesusers have liked this narrative
RO


Robbo on Fiducian Group ·
Fiducian: Compliance Clouds or Value Opportunity?
Fair Value:AU$126.1% undervalued
3 followersusers have followed this narrative
0 commentsusers have commented on this narrative
0 likesusers have liked this narrative
WO

woodworthfund on Willamette Valley Vineyards ·
Willamette Valley Vineyards (WVVI): Not-So-Great Value
Fair Value:US$242.5% overvalued
5 followersusers have followed this narrative
0 commentsusers have commented on this narrative
1 likeusers have liked this narrative
Recently Updated Narratives
MA


MarkoVT on Alphabet ·
Positioned globally, partnered locally
Fair Value:US$390.1919.1% undervalued
1 followerusers have followed this narrative
0 commentsusers have commented on this narrative
0 likesusers have liked this narrative
JO


JohnJ on Worldline ·
When will fraudsters be investigated in depth. Fraud was ongoing in France too.
Fair Value:€0.5200.8% overvalued
1 followerusers have followed this narrative
0 commentsusers have commented on this narrative
0 likesusers have liked this narrative
MA

MarkoVT on Applied Digital ·
Staggered by dilution; positions for growth
Fair Value:US$35.4520.9% undervalued
5 followersusers have followed this narrative
0 commentsusers have commented on this narrative
0 likesusers have liked this narrative
Popular Narratives
TH


TheWallstreetKing on MicroVision ·
MicroVision will explode future revenue by 380.37% with a vision towards success
Fair Value:US$6098.6% undervalued
112 followersusers have followed this narrative
11 commentsusers have commented on this narrative
22 likesusers have liked this narrative
AN


AnalystConsensusTarget on NVIDIA ·
NVDA: Expanding AI Demand Will Drive Major Data Center Investments Through 2026
Fair Value:US$250.3927.5% undervalued
949 followersusers have followed this narrative
6 commentsusers have commented on this narrative
24 likesusers have liked this narrative
OS

oscargarcia on Alphabet ·
The company that turned a verb into a global necessity and basically runs the modern internet, digital ads, smartphones, maps, and AI.
Fair Value:US$3407.1% undervalued
148 followersusers have followed this narrative
6 commentsusers have commented on this narrative
18 likesusers have liked this narrative

