- South Korea
- /
- Luxury
- /
- KOSDAQ:A098660
Can STO Co., Ltd.'s (KOSDAQ:098660) Weak Financials Pull The Plug On The Stock's Current Momentum On Its Share Price?


Most readers would already be aware that STO's (KOSDAQ:098660) stock increased significantly by 67% over the past three months. However, in this article, we decided to focus on its weak fundamentals, as long-term financial performance of a business is what ultimately dictates market outcomes. In this article, we decided to focus on STO's ROE.
Return on equity or ROE is a key measure used to assess how efficiently a company's management is utilizing the company's capital. In other words, it is a profitability ratio which measures the rate of return on the capital provided by the company's shareholders.
Check out our latest analysis for STO
How Do You Calculate Return On Equity?
The formula for ROE is:
Return on Equity = Net Profit (from continuing operations) ÷ Shareholders' Equity
So, based on the above formula, the ROE for STO is:
2.6% = ₩747m ÷ ₩29b (Based on the trailing twelve months to June 2024).
The 'return' is the yearly profit. That means that for every ₩1 worth of shareholders' equity, the company generated ₩0.03 in profit.
What Has ROE Got To Do With Earnings Growth?
So far, we've learned that ROE is a measure of a company's profitability. We now need to evaluate how much profit the company reinvests or "retains" for future growth which then gives us an idea about the growth potential of the company. Assuming everything else remains unchanged, the higher the ROE and profit retention, the higher the growth rate of a company compared to companies that don't necessarily bear these characteristics.
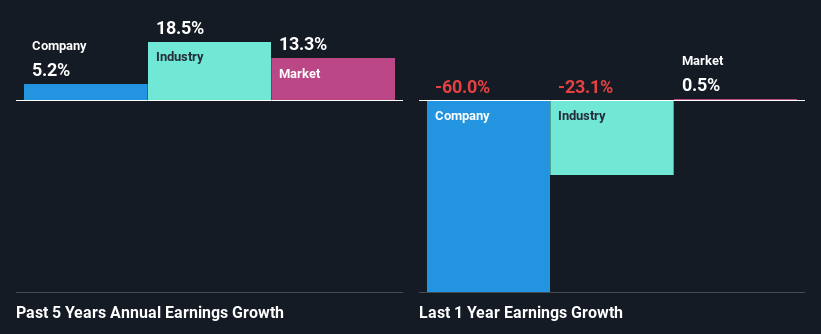
A Side By Side comparison of STO's Earnings Growth And 2.6% ROE
As you can see, STO's ROE looks pretty weak. Not just that, even compared to the industry average of 5.3%, the company's ROE is entirely unremarkable. However, the moderate 5.2% net income growth seen by STO over the past five years is definitely a positive. We believe that there might be other aspects that are positively influencing the company's earnings growth. Such as - high earnings retention or an efficient management in place.
Next, on comparing with the industry net income growth, we found that STO's reported growth was lower than the industry growth of 18% over the last few years, which is not something we like to see.
The basis for attaching value to a company is, to a great extent, tied to its earnings growth. What investors need to determine next is if the expected earnings growth, or the lack of it, is already built into the share price. This then helps them determine if the stock is placed for a bright or bleak future. Is STO fairly valued compared to other companies? These 3 valuation measures might help you decide.
Is STO Efficiently Re-investing Its Profits?
STO has a very high three-year median payout ratio of 102% suggesting that the company's shareholders are getting paid from more than just the company's earnings. In spite of this, the company was able to grow its earnings respectably, as we saw above. It would still be worth keeping an eye on that high payout ratio, if for some reason the company runs into problems and business deteriorates. To know the 5 risks we have identified for STO visit our risks dashboard for free.
Besides, STO has been paying dividends over a period of five years. This shows that the company is committed to sharing profits with its shareholders.
Summary
In total, we would have a hard think before deciding on any investment action concerning STO. While the company has posted decent earnings growth, the company is retaining little to no profits and is reinvesting those profits at a low rate of return. This makes us doubtful if that growth could continue, especially if by any chance the business is faced with any sort of risk. So far, we've only made a quick discussion around the company's earnings growth. So it may be worth checking this free detailed graph of STO's past earnings, as well as revenue and cash flows to get a deeper insight into the company's performance.
New: Manage All Your Stock Portfolios in One Place
We've created the ultimate portfolio companion for stock investors, and it's free.
• Connect an unlimited number of Portfolios and see your total in one currency
• Be alerted to new Warning Signs or Risks via email or mobile
• Track the Fair Value of your stocks
Have feedback on this article? Concerned about the content? Get in touch with us directly. Alternatively, email editorial-team (at) simplywallst.com.
This article by Simply Wall St is general in nature. We provide commentary based on historical data and analyst forecasts only using an unbiased methodology and our articles are not intended to be financial advice. It does not constitute a recommendation to buy or sell any stock, and does not take account of your objectives, or your financial situation. We aim to bring you long-term focused analysis driven by fundamental data. Note that our analysis may not factor in the latest price-sensitive company announcements or qualitative material. Simply Wall St has no position in any stocks mentioned.
About KOSDAQ:A098660
STO
Engages in the manufacture, distribution, and sale of men's clothing, leather, and accessories.
Low with imperfect balance sheet.
Market Insights

Community Narratives

