- South Korea
- /
- Machinery
- /
- KOSE:A075580
Sejin Heavy Industries Co., Ltd.'s (KRX:075580) 25% Share Price Surge Not Quite Adding Up


Sejin Heavy Industries Co., Ltd. (KRX:075580) shares have continued their recent momentum with a 25% gain in the last month alone. Taking a wider view, although not as strong as the last month, the full year gain of 24% is also fairly reasonable.
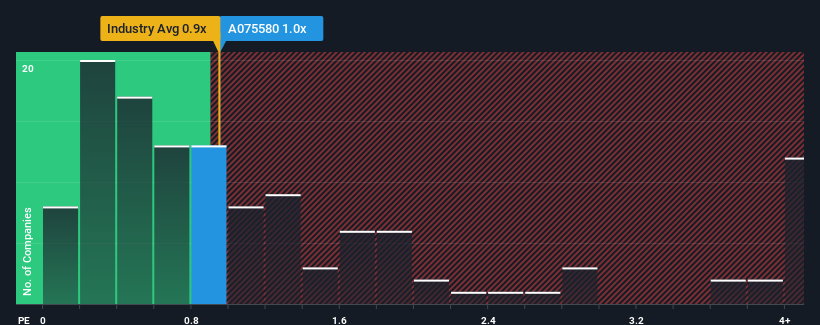
Although its price has surged higher, it's still not a stretch to say that Sejin Heavy Industries' price-to-sales (or "P/S") ratio of 1x right now seems quite "middle-of-the-road" compared to the Machinery industry in Korea, where the median P/S ratio is around 0.9x. Although, it's not wise to simply ignore the P/S without explanation as investors may be disregarding a distinct opportunity or a costly mistake.
See our latest analysis for Sejin Heavy Industries
How Sejin Heavy Industries Has Been Performing
Sejin Heavy Industries could be doing better as its revenue has been going backwards lately while most other companies have been seeing positive revenue growth. One possibility is that the P/S ratio is moderate because investors think this poor revenue performance will turn around. If not, then existing shareholders may be a little nervous about the viability of the share price.
If you'd like to see what analysts are forecasting going forward, you should check out our free report on Sejin Heavy Industries.Do Revenue Forecasts Match The P/S Ratio?
Sejin Heavy Industries' P/S ratio would be typical for a company that's only expected to deliver moderate growth, and importantly, perform in line with the industry.
In reviewing the last year of financials, we were disheartened to see the company's revenues fell to the tune of 3.9%. However, a few very strong years before that means that it was still able to grow revenue by an impressive 34% in total over the last three years. Although it's been a bumpy ride, it's still fair to say the revenue growth recently has been more than adequate for the company.
Looking ahead now, revenue is anticipated to climb by 9.9% during the coming year according to the two analysts following the company. With the industry predicted to deliver 32% growth, the company is positioned for a weaker revenue result.
In light of this, it's curious that Sejin Heavy Industries' P/S sits in line with the majority of other companies. Apparently many investors in the company are less bearish than analysts indicate and aren't willing to let go of their stock right now. Maintaining these prices will be difficult to achieve as this level of revenue growth is likely to weigh down the shares eventually.
The Bottom Line On Sejin Heavy Industries' P/S
Sejin Heavy Industries appears to be back in favour with a solid price jump bringing its P/S back in line with other companies in the industry Using the price-to-sales ratio alone to determine if you should sell your stock isn't sensible, however it can be a practical guide to the company's future prospects.
Given that Sejin Heavy Industries' revenue growth projections are relatively subdued in comparison to the wider industry, it comes as a surprise to see it trading at its current P/S ratio. At present, we aren't confident in the P/S as the predicted future revenues aren't likely to support a more positive sentiment for long. A positive change is needed in order to justify the current price-to-sales ratio.
It is also worth noting that we have found 3 warning signs for Sejin Heavy Industries (1 shouldn't be ignored!) that you need to take into consideration.
If companies with solid past earnings growth is up your alley, you may wish to see this free collection of other companies with strong earnings growth and low P/E ratios.
If you're looking to trade Sejin Heavy Industries, open an account with the lowest-cost platform trusted by professionals, Interactive Brokers.
With clients in over 200 countries and territories, and access to 160 markets, IBKR lets you trade stocks, options, futures, forex, bonds and funds from a single integrated account.
Enjoy no hidden fees, no account minimums, and FX conversion rates as low as 0.03%, far better than what most brokers offer.
Sponsored ContentNew: Manage All Your Stock Portfolios in One Place
We've created the ultimate portfolio companion for stock investors, and it's free.
• Connect an unlimited number of Portfolios and see your total in one currency
• Be alerted to new Warning Signs or Risks via email or mobile
• Track the Fair Value of your stocks
Have feedback on this article? Concerned about the content? Get in touch with us directly. Alternatively, email editorial-team (at) simplywallst.com.
This article by Simply Wall St is general in nature. We provide commentary based on historical data and analyst forecasts only using an unbiased methodology and our articles are not intended to be financial advice. It does not constitute a recommendation to buy or sell any stock, and does not take account of your objectives, or your financial situation. We aim to bring you long-term focused analysis driven by fundamental data. Note that our analysis may not factor in the latest price-sensitive company announcements or qualitative material. Simply Wall St has no position in any stocks mentioned.
About KOSE:A075580
Sejin Heavy Industries
Manufactures and sells shipbuilding equipment in South Korea.
High growth potential with solid track record.

