
Advertisement
- South Korea
- /
- Machinery
- /
- KOSE:A064350
Hyundai Rotem Company's (KRX:064350) Intrinsic Value Is Potentially 84% Above Its Share Price

Key Insights
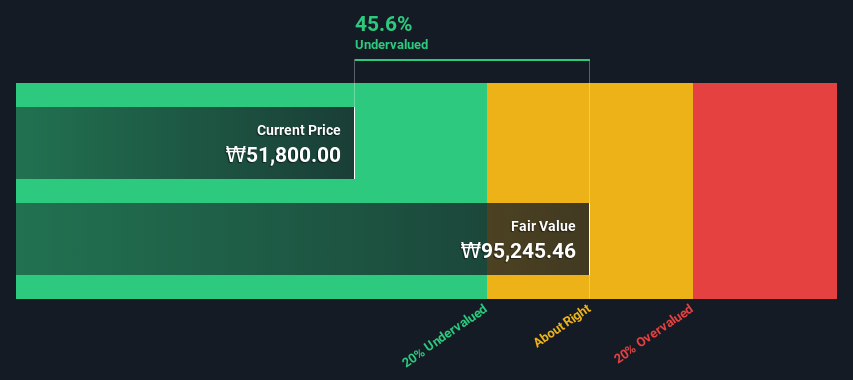
- The projected fair value for Hyundai Rotem is ₩95,245 based on 2 Stage Free Cash Flow to Equity
- Hyundai Rotem is estimated to be 46% undervalued based on current share price of ₩51,800
- Analyst price target for A064350 is ₩61,333 which is 36% below our fair value estimate
Today we'll do a simple run through of a valuation method used to estimate the attractiveness of Hyundai Rotem Company (KRX:064350) as an investment opportunity by taking the expected future cash flows and discounting them to today's value. Our analysis will employ the Discounted Cash Flow (DCF) model. Believe it or not, it's not too difficult to follow, as you'll see from our example!
Companies can be valued in a lot of ways, so we would point out that a DCF is not perfect for every situation. If you want to learn more about discounted cash flow, the rationale behind this calculation can be read in detail in the Simply Wall St analysis model.
View our latest analysis for Hyundai Rotem
Is Hyundai Rotem Fairly Valued?
We use what is known as a 2-stage model, which simply means we have two different periods of growth rates for the company's cash flows. Generally the first stage is higher growth, and the second stage is a lower growth phase. To start off with, we need to estimate the next ten years of cash flows. Where possible we use analyst estimates, but when these aren't available we extrapolate the previous free cash flow (FCF) from the last estimate or reported value. We assume companies with shrinking free cash flow will slow their rate of shrinkage, and that companies with growing free cash flow will see their growth rate slow, over this period. We do this to reflect that growth tends to slow more in the early years than it does in later years.
Generally we assume that a dollar today is more valuable than a dollar in the future, and so the sum of these future cash flows is then discounted to today's value:
10-year free cash flow (FCF) forecast
| 2025 | 2026 | 2027 | 2028 | 2029 | 2030 | 2031 | 2032 | 2033 | 2034 | |
| Levered FCF (₩, Millions) | ₩457.7b | ₩485.2b | ₩507.2b | ₩527.2b | ₩545.7b | ₩563.4b | ₩580.5b | ₩597.3b | ₩613.9b | ₩630.7b |
| Growth Rate Estimate Source | Analyst x6 | Analyst x6 | Est @ 4.53% | Est @ 3.94% | Est @ 3.52% | Est @ 3.24% | Est @ 3.03% | Est @ 2.89% | Est @ 2.79% | Est @ 2.72% |
| Present Value (₩, Millions) Discounted @ 7.3% | ₩426.4k | ₩421.1k | ₩410.1k | ₩397.1k | ₩383.0k | ₩368.3k | ₩353.5k | ₩338.9k | ₩324.5k | ₩310.6k |
("Est" = FCF growth rate estimated by Simply Wall St)
Present Value of 10-year Cash Flow (PVCF) = ₩3.7t
After calculating the present value of future cash flows in the initial 10-year period, we need to calculate the Terminal Value, which accounts for all future cash flows beyond the first stage. For a number of reasons a very conservative growth rate is used that cannot exceed that of a country's GDP growth. In this case we have used the 5-year average of the 10-year government bond yield (2.6%) to estimate future growth. In the same way as with the 10-year 'growth' period, we discount future cash flows to today's value, using a cost of equity of 7.3%.
Terminal Value (TV)= FCF2034 × (1 + g) ÷ (r – g) = ₩631b× (1 + 2.6%) ÷ (7.3%– 2.6%) = ₩14t
Present Value of Terminal Value (PVTV)= TV / (1 + r)10= ₩14t÷ ( 1 + 7.3%)10= ₩6.7t
The total value is the sum of cash flows for the next ten years plus the discounted terminal value, which results in the Total Equity Value, which in this case is ₩10t. In the final step we divide the equity value by the number of shares outstanding. Relative to the current share price of ₩52k, the company appears quite undervalued at a 46% discount to where the stock price trades currently. Valuations are imprecise instruments though, rather like a telescope - move a few degrees and end up in a different galaxy. Do keep this in mind.
Important Assumptions
We would point out that the most important inputs to a discounted cash flow are the discount rate and of course the actual cash flows. Part of investing is coming up with your own evaluation of a company's future performance, so try the calculation yourself and check your own assumptions. The DCF also does not consider the possible cyclicality of an industry, or a company's future capital requirements, so it does not give a full picture of a company's potential performance. Given that we are looking at Hyundai Rotem as potential shareholders, the cost of equity is used as the discount rate, rather than the cost of capital (or weighted average cost of capital, WACC) which accounts for debt. In this calculation we've used 7.3%, which is based on a levered beta of 1.013. Beta is a measure of a stock's volatility, compared to the market as a whole. We get our beta from the industry average beta of globally comparable companies, with an imposed limit between 0.8 and 2.0, which is a reasonable range for a stable business.
SWOT Analysis for Hyundai Rotem
Strength
- Earnings growth over the past year exceeded the industry.
- Debt is not viewed as a risk.
Weakness
- Earnings growth over the past year is below its 5-year average.
- Dividend is low compared to the top 25% of dividend payers in the Machinery market.
Opportunity
- Annual revenue is forecast to grow faster than the South Korean market.
- Trading below our estimate of fair value by more than 20%.
Threat
- Annual earnings are forecast to grow slower than the South Korean market.
Next Steps:
Valuation is only one side of the coin in terms of building your investment thesis, and it is only one of many factors that you need to assess for a company. DCF models are not the be-all and end-all of investment valuation. Preferably you'd apply different cases and assumptions and see how they would impact the company's valuation. For instance, if the terminal value growth rate is adjusted slightly, it can dramatically alter the overall result. Can we work out why the company is trading at a discount to intrinsic value? For Hyundai Rotem, we've put together three essential aspects you should look at:
- Financial Health: Does A064350 have a healthy balance sheet? Take a look at our free balance sheet analysis with six simple checks on key factors like leverage and risk.
- Future Earnings: How does A064350's growth rate compare to its peers and the wider market? Dig deeper into the analyst consensus number for the upcoming years by interacting with our free analyst growth expectation chart.
- Other Solid Businesses: Low debt, high returns on equity and good past performance are fundamental to a strong business. Why not explore our interactive list of stocks with solid business fundamentals to see if there are other companies you may not have considered!
PS. The Simply Wall St app conducts a discounted cash flow valuation for every stock on the KOSE every day. If you want to find the calculation for other stocks just search here.
Valuation is complex, but we're here to simplify it.
Discover if Hyundai Rotem might be undervalued or overvalued with our detailed analysis, featuring fair value estimates, potential risks, dividends, insider trades, and its financial condition.
Access Free AnalysisHave feedback on this article? Concerned about the content? Get in touch with us directly. Alternatively, email editorial-team (at) simplywallst.com.
This article by Simply Wall St is general in nature. We provide commentary based on historical data and analyst forecasts only using an unbiased methodology and our articles are not intended to be financial advice. It does not constitute a recommendation to buy or sell any stock, and does not take account of your objectives, or your financial situation. We aim to bring you long-term focused analysis driven by fundamental data. Note that our analysis may not factor in the latest price-sensitive company announcements or qualitative material. Simply Wall St has no position in any stocks mentioned.
About KOSE:A064350
Hyundai Rotem
Manufactures and sells railway vehicles, defense systems, and plants and machinery in South Korea and internationally.
Flawless balance sheet with high growth potential.
Similar Companies
Market Insights


Advertisement
Community Narratives
SSAB in pole position when it comes to the combination of steel tariffs and the EU's investment drive
Fair Value SEK 98.20|46.5% undervalued
PI
Community Contributor
The Future of Lennar and Homebuilding Faces Short Term Challenges with Potential for Long Term Growth
Fair Value US$162.49|34.1% undervalued
ZE
Community Contributor
Saudi Aramco (SASE:2222): Not The Sexiest High Dividend Yield Stock, But One With Interesting 'Convertible-Like' Qualities
Fair Value ر.س37.02|31.1% undervalued
EV
Community Contributor