- South Korea
- /
- Machinery
- /
- KOSE:A064350
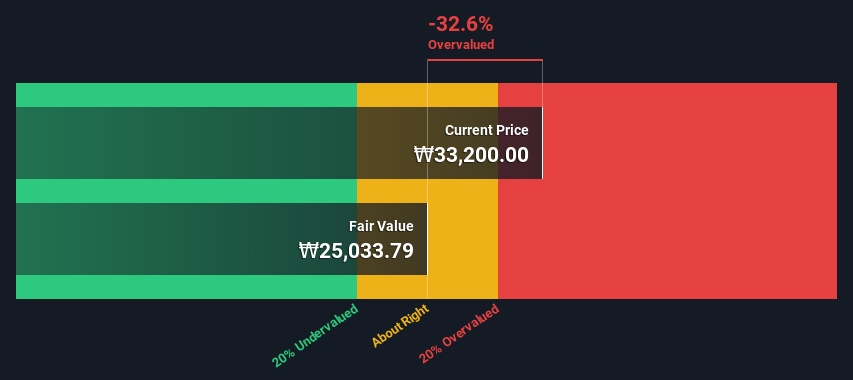
Hyundai Rotem Company's (KRX:064350) Intrinsic Value Is Potentially 25% Below Its Share Price


Key Insights
- The projected fair value for Hyundai Rotem is ₩25,034 based on 2 Stage Free Cash Flow to Equity
- Current share price of ₩33,200 suggests Hyundai Rotem is potentially 33% overvalued
- Our fair value estimate is 35% lower than Hyundai Rotem's analyst price target of ₩38,273
Today we'll do a simple run through of a valuation method used to estimate the attractiveness of Hyundai Rotem Company (KRX:064350) as an investment opportunity by taking the forecast future cash flows of the company and discounting them back to today's value. This will be done using the Discounted Cash Flow (DCF) model. There's really not all that much to it, even though it might appear quite complex.
Remember though, that there are many ways to estimate a company's value, and a DCF is just one method. Anyone interested in learning a bit more about intrinsic value should have a read of the Simply Wall St analysis model.
See our latest analysis for Hyundai Rotem
The Calculation
We're using the 2-stage growth model, which simply means we take in account two stages of company's growth. In the initial period the company may have a higher growth rate and the second stage is usually assumed to have a stable growth rate. In the first stage we need to estimate the cash flows to the business over the next ten years. Where possible we use analyst estimates, but when these aren't available we extrapolate the previous free cash flow (FCF) from the last estimate or reported value. We assume companies with shrinking free cash flow will slow their rate of shrinkage, and that companies with growing free cash flow will see their growth rate slow, over this period. We do this to reflect that growth tends to slow more in the early years than it does in later years.
Generally we assume that a dollar today is more valuable than a dollar in the future, so we discount the value of these future cash flows to their estimated value in today's dollars:
10-year free cash flow (FCF) forecast
| 2024 | 2025 | 2026 | 2027 | 2028 | 2029 | 2030 | 2031 | 2032 | 2033 | |
| Levered FCF (₩, Millions) | ₩234.6b | ₩308.8b | ₩242.7b | ₩208.0b | ₩188.8b | ₩177.9b | ₩172.0b | ₩169.3b | ₩168.6b | ₩169.3b |
| Growth Rate Estimate Source | Analyst x5 | Analyst x6 | Est @ -21.42% | Est @ -14.27% | Est @ -9.26% | Est @ -5.76% | Est @ -3.31% | Est @ -1.59% | Est @ -0.39% | Est @ 0.45% |
| Present Value (₩, Millions) Discounted @ 8.3% | ₩216.6k | ₩263.3k | ₩191.0k | ₩151.2k | ₩126.7k | ₩110.3k | ₩98.4k | ₩89.4k | ₩82.3k | ₩76.3k |
("Est" = FCF growth rate estimated by Simply Wall St)
Present Value of 10-year Cash Flow (PVCF) = ₩1.4t
We now need to calculate the Terminal Value, which accounts for all the future cash flows after this ten year period. The Gordon Growth formula is used to calculate Terminal Value at a future annual growth rate equal to the 5-year average of the 10-year government bond yield of 2.4%. We discount the terminal cash flows to today's value at a cost of equity of 8.3%.
Terminal Value (TV)= FCF2033 × (1 + g) ÷ (r – g) = ₩169b× (1 + 2.4%) ÷ (8.3%– 2.4%) = ₩2.9t
Present Value of Terminal Value (PVTV)= TV / (1 + r)10= ₩2.9t÷ ( 1 + 8.3%)10= ₩1.3t
The total value is the sum of cash flows for the next ten years plus the discounted terminal value, which results in the Total Equity Value, which in this case is ₩2.7t. The last step is to then divide the equity value by the number of shares outstanding. Compared to the current share price of ₩33k, the company appears potentially overvalued at the time of writing. The assumptions in any calculation have a big impact on the valuation, so it is better to view this as a rough estimate, not precise down to the last cent.
The Assumptions
Now the most important inputs to a discounted cash flow are the discount rate, and of course, the actual cash flows. Part of investing is coming up with your own evaluation of a company's future performance, so try the calculation yourself and check your own assumptions. The DCF also does not consider the possible cyclicality of an industry, or a company's future capital requirements, so it does not give a full picture of a company's potential performance. Given that we are looking at Hyundai Rotem as potential shareholders, the cost of equity is used as the discount rate, rather than the cost of capital (or weighted average cost of capital, WACC) which accounts for debt. In this calculation we've used 8.3%, which is based on a levered beta of 1.107. Beta is a measure of a stock's volatility, compared to the market as a whole. We get our beta from the industry average beta of globally comparable companies, with an imposed limit between 0.8 and 2.0, which is a reasonable range for a stable business.
SWOT Analysis for Hyundai Rotem
- Debt is not viewed as a risk.
- Earnings declined over the past year.
- Dividend is low compared to the top 25% of dividend payers in the Machinery market.
- Expensive based on P/E ratio and estimated fair value.
- Annual revenue is forecast to grow faster than the South Korean market.
- Annual earnings are forecast to grow slower than the South Korean market.
Next Steps:
Although the valuation of a company is important, it shouldn't be the only metric you look at when researching a company. DCF models are not the be-all and end-all of investment valuation. Instead the best use for a DCF model is to test certain assumptions and theories to see if they would lead to the company being undervalued or overvalued. For instance, if the terminal value growth rate is adjusted slightly, it can dramatically alter the overall result. Can we work out why the company is trading at a premium to intrinsic value? For Hyundai Rotem, we've put together three further elements you should assess:
- Financial Health: Does A064350 have a healthy balance sheet? Take a look at our free balance sheet analysis with six simple checks on key factors like leverage and risk.
- Future Earnings: How does A064350's growth rate compare to its peers and the wider market? Dig deeper into the analyst consensus number for the upcoming years by interacting with our free analyst growth expectation chart.
- Other Solid Businesses: Low debt, high returns on equity and good past performance are fundamental to a strong business. Why not explore our interactive list of stocks with solid business fundamentals to see if there are other companies you may not have considered!
PS. Simply Wall St updates its DCF calculation for every South Korean stock every day, so if you want to find the intrinsic value of any other stock just search here.
Valuation is complex, but we're here to simplify it.
Discover if Hyundai Rotem might be undervalued or overvalued with our detailed analysis, featuring fair value estimates, potential risks, dividends, insider trades, and its financial condition.
Access Free AnalysisHave feedback on this article? Concerned about the content? Get in touch with us directly. Alternatively, email editorial-team (at) simplywallst.com.
This article by Simply Wall St is general in nature. We provide commentary based on historical data and analyst forecasts only using an unbiased methodology and our articles are not intended to be financial advice. It does not constitute a recommendation to buy or sell any stock, and does not take account of your objectives, or your financial situation. We aim to bring you long-term focused analysis driven by fundamental data. Note that our analysis may not factor in the latest price-sensitive company announcements or qualitative material. Simply Wall St has no position in any stocks mentioned.
About KOSE:A064350
Hyundai Rotem
Manufactures and sells railway vehicles, defense systems, and plants and machinery in South Korea and internationally.
Outstanding track record with flawless balance sheet.
Similar Companies
Market Insights

Community Narratives

