- South Korea
- /
- Industrials
- /
- KOSE:A001040
Earnings grew faster than the favorable 45% return delivered to CJ (KRX:001040) shareholders over the last year


Passive investing in index funds can generate returns that roughly match the overall market. But if you pick the right individual stocks, you could make more than that. To wit, the CJ Corporation (KRX:001040) share price is 42% higher than it was a year ago, much better than the market return of around 6.3% (not including dividends) in the same period. That's a solid performance by our standards! Having said that, the longer term returns aren't so impressive, with stock gaining just 18% in three years.
Since the long term performance has been good but there's been a recent pullback of 3.6%, let's check if the fundamentals match the share price.
See our latest analysis for CJ
In his essay The Superinvestors of Graham-and-Doddsville Warren Buffett described how share prices do not always rationally reflect the value of a business. One way to examine how market sentiment has changed over time is to look at the interaction between a company's share price and its earnings per share (EPS).
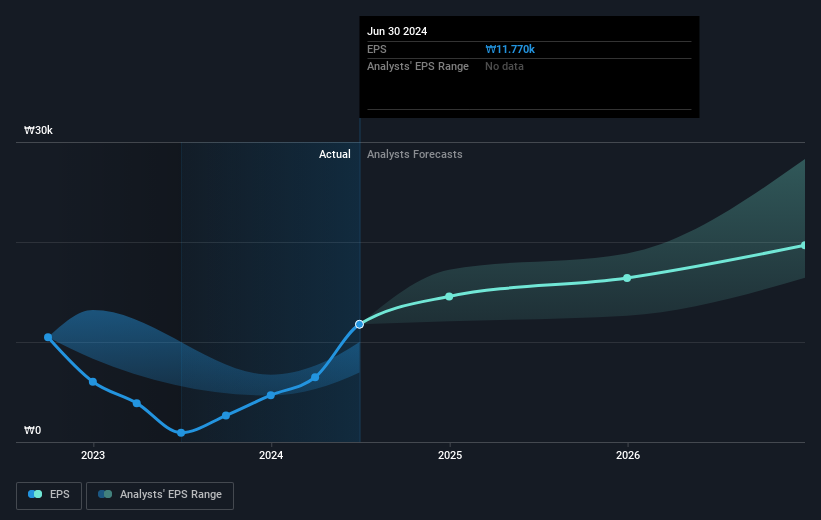
CJ boasted truly magnificent EPS growth in the last year. We don't think the exact number is a good guide to the sustainable growth rate, but we do think this sort of increase is impressive. We are not surprised the share price is up. We're real advocates of letting inflection points like this guide our research as stock pickers.
The image below shows how EPS has tracked over time (if you click on the image you can see greater detail).
We know that CJ has improved its bottom line over the last three years, but what does the future have in store? This free interactive report on CJ's balance sheet strength is a great place to start, if you want to investigate the stock further.
What About Dividends?
When looking at investment returns, it is important to consider the difference between total shareholder return (TSR) and share price return. The TSR is a return calculation that accounts for the value of cash dividends (assuming that any dividend received was reinvested) and the calculated value of any discounted capital raisings and spin-offs. It's fair to say that the TSR gives a more complete picture for stocks that pay a dividend. As it happens, CJ's TSR for the last 1 year was 45%, which exceeds the share price return mentioned earlier. This is largely a result of its dividend payments!
A Different Perspective
We're pleased to report that CJ shareholders have received a total shareholder return of 45% over one year. And that does include the dividend. That gain is better than the annual TSR over five years, which is 10%. Therefore it seems like sentiment around the company has been positive lately. Someone with an optimistic perspective could view the recent improvement in TSR as indicating that the business itself is getting better with time. I find it very interesting to look at share price over the long term as a proxy for business performance. But to truly gain insight, we need to consider other information, too. Consider for instance, the ever-present spectre of investment risk. We've identified 2 warning signs with CJ , and understanding them should be part of your investment process.
If you would prefer to check out another company -- one with potentially superior financials -- then do not miss this free list of companies that have proven they can grow earnings.
Please note, the market returns quoted in this article reflect the market weighted average returns of stocks that currently trade on South Korean exchanges.
New: AI Stock Screener & Alerts
Our new AI Stock Screener scans the market every day to uncover opportunities.
• Dividend Powerhouses (3%+ Yield)
• Undervalued Small Caps with Insider Buying
• High growth Tech and AI Companies
Or build your own from over 50 metrics.
Have feedback on this article? Concerned about the content? Get in touch with us directly. Alternatively, email editorial-team (at) simplywallst.com.
This article by Simply Wall St is general in nature. We provide commentary based on historical data and analyst forecasts only using an unbiased methodology and our articles are not intended to be financial advice. It does not constitute a recommendation to buy or sell any stock, and does not take account of your objectives, or your financial situation. We aim to bring you long-term focused analysis driven by fundamental data. Note that our analysis may not factor in the latest price-sensitive company announcements or qualitative material. Simply Wall St has no position in any stocks mentioned.
About KOSE:A001040
CJ
Engages in the food and food services, bio, logistics and retail, and entertainment and media businesses worldwide.
Good value with adequate balance sheet and pays a dividend.

