

Warren Buffett famously said, 'Volatility is far from synonymous with risk.' When we think about how risky a company is, we always like to look at its use of debt, since debt overload can lead to ruin. Importantly, SuNam Co., Ltd. (KOSDAQ:294630) does carry debt. But the real question is whether this debt is making the company risky.
Why Does Debt Bring Risk?
Debt assists a business until the business has trouble paying it off, either with new capital or with free cash flow. Part and parcel of capitalism is the process of 'creative destruction' where failed businesses are mercilessly liquidated by their bankers. However, a more frequent (but still costly) occurrence is where a company must issue shares at bargain-basement prices, permanently diluting shareholders, just to shore up its balance sheet. Of course, the upside of debt is that it often represents cheap capital, especially when it replaces dilution in a company with the ability to reinvest at high rates of return. The first thing to do when considering how much debt a business uses is to look at its cash and debt together.
View our latest analysis for SuNam
What Is SuNam's Net Debt?
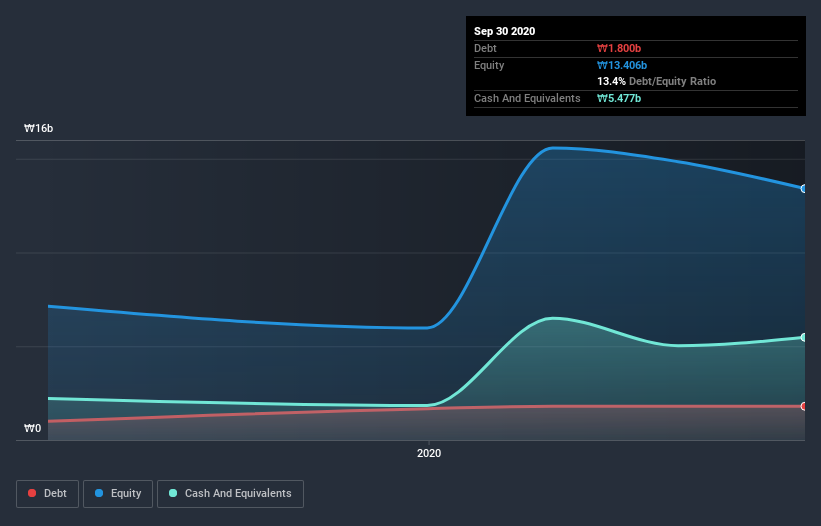
The image below, which you can click on for greater detail, shows that at September 2020 SuNam had debt of ₩1.80b, up from ₩1.67b in one year. However, it does have ₩5.48b in cash offsetting this, leading to net cash of ₩3.68b.
A Look At SuNam's Liabilities
The latest balance sheet data shows that SuNam had liabilities of ₩1.53b due within a year, and liabilities of ₩2.39b falling due after that. On the other hand, it had cash of ₩5.48b and ₩95.6m worth of receivables due within a year. So it can boast ₩1.65b more liquid assets than total liabilities.
This surplus suggests that SuNam has a conservative balance sheet, and could probably eliminate its debt without much difficulty. Simply put, the fact that SuNam has more cash than debt is arguably a good indication that it can manage its debt safely. When analysing debt levels, the balance sheet is the obvious place to start. But it is SuNam's earnings that will influence how the balance sheet holds up in the future. So when considering debt, it's definitely worth looking at the earnings trend. Click here for an interactive snapshot.
In the last year SuNam had a loss before interest and tax, and actually shrunk its revenue by 17%, to ₩1.8b. That's not what we would hope to see.
So How Risky Is SuNam?
By their very nature companies that are losing money are more risky than those with a long history of profitability. And in the last year SuNam had an earnings before interest and tax (EBIT) loss, truth be told. Indeed, in that time it burnt through ₩6.6b of cash and made a loss of ₩5.0b. Given it only has net cash of ₩3.68b, the company may need to raise more capital if it doesn't reach break-even soon. Even though its balance sheet seems sufficiently liquid, debt always makes us a little nervous if a company doesn't produce free cash flow regularly. The balance sheet is clearly the area to focus on when you are analysing debt. But ultimately, every company can contain risks that exist outside of the balance sheet. For instance, we've identified 5 warning signs for SuNam (1 is a bit unpleasant) you should be aware of.
When all is said and done, sometimes its easier to focus on companies that don't even need debt. Readers can access a list of growth stocks with zero net debt 100% free, right now.
If you decide to trade SuNam, use the lowest-cost* platform that is rated #1 Overall by Barron’s, Interactive Brokers. Trade stocks, options, futures, forex, bonds and funds on 135 markets, all from a single integrated account. Promoted
If you're looking to trade SuNam, open an account with the lowest-cost platform trusted by professionals, Interactive Brokers.
With clients in over 200 countries and territories, and access to 160 markets, IBKR lets you trade stocks, options, futures, forex, bonds and funds from a single integrated account.
Enjoy no hidden fees, no account minimums, and FX conversion rates as low as 0.03%, far better than what most brokers offer.
Sponsored ContentNew: Manage All Your Stock Portfolios in One Place
We've created the ultimate portfolio companion for stock investors, and it's free.
• Connect an unlimited number of Portfolios and see your total in one currency
• Be alerted to new Warning Signs or Risks via email or mobile
• Track the Fair Value of your stocks
This article by Simply Wall St is general in nature. It does not constitute a recommendation to buy or sell any stock, and does not take account of your objectives, or your financial situation. We aim to bring you long-term focused analysis driven by fundamental data. Note that our analysis may not factor in the latest price-sensitive company announcements or qualitative material. Simply Wall St has no position in any stocks mentioned.
*Interactive Brokers Rated Lowest Cost Broker by StockBrokers.com Annual Online Review 2020
Have feedback on this article? Concerned about the content? Get in touch with us directly. Alternatively, email editorial-team@simplywallst.com.
About KOSDAQ:A294630
SuNam
Manufactures and sells conducting wire and high-magnetic materials in South Korea.
Adequate balance sheet slight.
Similar Companies
Market Insights

Community Narratives

