- South Korea
- /
- Electrical
- /
- KOSDAQ:A147830
Risks Still Elevated At These Prices As Cheryong Industrial Co.,Ltd. (KOSDAQ:147830) Shares Dive 27%


Cheryong Industrial Co.,Ltd. (KOSDAQ:147830) shares have had a horrible month, losing 27% after a relatively good period beforehand. Still, a bad month hasn't completely ruined the past year with the stock gaining 49%, which is great even in a bull market.
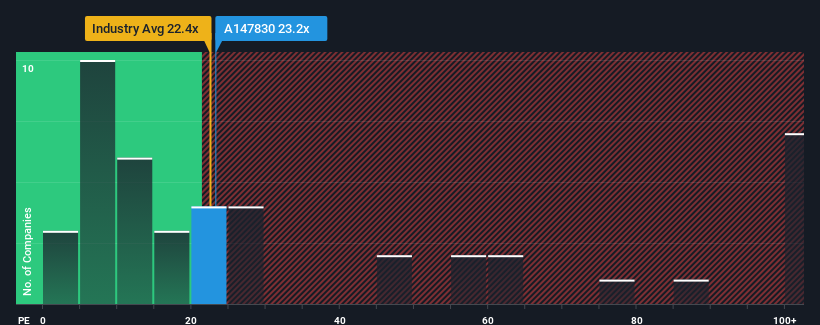
In spite of the heavy fall in price, Cheryong IndustrialLtd may still be sending very bearish signals at the moment with a price-to-earnings (or "P/E") ratio of 23.2x, since almost half of all companies in Korea have P/E ratios under 11x and even P/E's lower than 6x are not unusual. However, the P/E might be quite high for a reason and it requires further investigation to determine if it's justified.
As an illustration, earnings have deteriorated at Cheryong IndustrialLtd over the last year, which is not ideal at all. One possibility is that the P/E is high because investors think the company will still do enough to outperform the broader market in the near future. You'd really hope so, otherwise you're paying a pretty hefty price for no particular reason.
View our latest analysis for Cheryong IndustrialLtd
How Is Cheryong IndustrialLtd's Growth Trending?
The only time you'd be truly comfortable seeing a P/E as steep as Cheryong IndustrialLtd's is when the company's growth is on track to outshine the market decidedly.
Taking a look back first, the company's earnings per share growth last year wasn't something to get excited about as it posted a disappointing decline of 52%. As a result, earnings from three years ago have also fallen 8.5% overall. Therefore, it's fair to say the earnings growth recently has been undesirable for the company.
Comparing that to the market, which is predicted to deliver 31% growth in the next 12 months, the company's downward momentum based on recent medium-term earnings results is a sobering picture.
In light of this, it's alarming that Cheryong IndustrialLtd's P/E sits above the majority of other companies. It seems most investors are ignoring the recent poor growth rate and are hoping for a turnaround in the company's business prospects. Only the boldest would assume these prices are sustainable as a continuation of recent earnings trends is likely to weigh heavily on the share price eventually.
What We Can Learn From Cheryong IndustrialLtd's P/E?
A significant share price dive has done very little to deflate Cheryong IndustrialLtd's very lofty P/E. Using the price-to-earnings ratio alone to determine if you should sell your stock isn't sensible, however it can be a practical guide to the company's future prospects.
Our examination of Cheryong IndustrialLtd revealed its shrinking earnings over the medium-term aren't impacting its high P/E anywhere near as much as we would have predicted, given the market is set to grow. Right now we are increasingly uncomfortable with the high P/E as this earnings performance is highly unlikely to support such positive sentiment for long. Unless the recent medium-term conditions improve markedly, it's very challenging to accept these prices as being reasonable.
There are also other vital risk factors to consider and we've discovered 4 warning signs for Cheryong IndustrialLtd (1 is a bit unpleasant!) that you should be aware of before investing here.
It's important to make sure you look for a great company, not just the first idea you come across. So take a peek at this free list of interesting companies with strong recent earnings growth (and a low P/E).
New: AI Stock Screener & Alerts
Our new AI Stock Screener scans the market every day to uncover opportunities.
• Dividend Powerhouses (3%+ Yield)
• Undervalued Small Caps with Insider Buying
• High growth Tech and AI Companies
Or build your own from over 50 metrics.
Have feedback on this article? Concerned about the content? Get in touch with us directly. Alternatively, email editorial-team (at) simplywallst.com.
This article by Simply Wall St is general in nature. We provide commentary based on historical data and analyst forecasts only using an unbiased methodology and our articles are not intended to be financial advice. It does not constitute a recommendation to buy or sell any stock, and does not take account of your objectives, or your financial situation. We aim to bring you long-term focused analysis driven by fundamental data. Note that our analysis may not factor in the latest price-sensitive company announcements or qualitative material. Simply Wall St has no position in any stocks mentioned.
Have feedback on this article? Concerned about the content? Get in touch with us directly. Alternatively, email editorial-team@simplywallst.com
About KOSDAQ:A147830
Cheryong IndustrialLtd
Manufactures and sells transmission and distribution materials, underground cable materials, communication equipment, and railway materials in South Korea.
Flawless balance sheet and fair value.
Market Insights

Community Narratives

