- South Korea
- /
- Electrical
- /
- KOSDAQ:A119850
Are Robust Financials Driving The Recent Rally In GnCenergy Co., Ltd's (KOSDAQ:119850) Stock?


GnCenergy (KOSDAQ:119850) has had a great run on the share market with its stock up by a significant 93% over the last three months. Given that the market rewards strong financials in the long-term, we wonder if that is the case in this instance. Specifically, we decided to study GnCenergy's ROE in this article.
Return on equity or ROE is an important factor to be considered by a shareholder because it tells them how effectively their capital is being reinvested. Simply put, it is used to assess the profitability of a company in relation to its equity capital.
View our latest analysis for GnCenergy
How Is ROE Calculated?
Return on equity can be calculated by using the formula:
Return on Equity = Net Profit (from continuing operations) ÷ Shareholders' Equity
So, based on the above formula, the ROE for GnCenergy is:
27% = ₩40b ÷ ₩151b (Based on the trailing twelve months to September 2024).
The 'return' is the profit over the last twelve months. One way to conceptualize this is that for each ₩1 of shareholders' capital it has, the company made ₩0.27 in profit.
What Is The Relationship Between ROE And Earnings Growth?
Thus far, we have learned that ROE measures how efficiently a company is generating its profits. We now need to evaluate how much profit the company reinvests or "retains" for future growth which then gives us an idea about the growth potential of the company. Generally speaking, other things being equal, firms with a high return on equity and profit retention, have a higher growth rate than firms that don’t share these attributes.
GnCenergy's Earnings Growth And 27% ROE
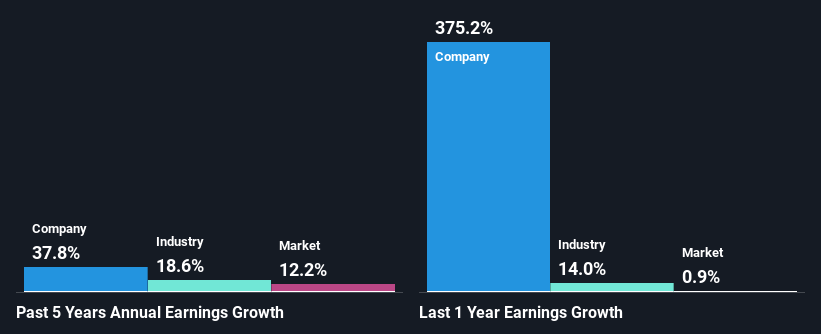
First thing first, we like that GnCenergy has an impressive ROE. Second, a comparison with the average ROE reported by the industry of 8.3% also doesn't go unnoticed by us. Under the circumstances, GnCenergy's considerable five year net income growth of 38% was to be expected.
We then compared GnCenergy's net income growth with the industry and we're pleased to see that the company's growth figure is higher when compared with the industry which has a growth rate of 19% in the same 5-year period.
Earnings growth is an important metric to consider when valuing a stock. It’s important for an investor to know whether the market has priced in the company's expected earnings growth (or decline). Doing so will help them establish if the stock's future looks promising or ominous. One good indicator of expected earnings growth is the P/E ratio which determines the price the market is willing to pay for a stock based on its earnings prospects. So, you may want to check if GnCenergy is trading on a high P/E or a low P/E, relative to its industry.
Is GnCenergy Efficiently Re-investing Its Profits?
GnCenergy has a really low three-year median payout ratio of 11%, meaning that it has the remaining 89% left over to reinvest into its business. This suggests that the management is reinvesting most of the profits to grow the business as evidenced by the growth seen by the company.
Additionally, GnCenergy has paid dividends over a period of five years which means that the company is pretty serious about sharing its profits with shareholders.
Summary
On the whole, we feel that GnCenergy's performance has been quite good. In particular, it's great to see that the company is investing heavily into its business and along with a high rate of return, that has resulted in a sizeable growth in its earnings. If the company continues to grow its earnings the way it has, that could have a positive impact on its share price given how earnings per share influence long-term share prices. Remember, the price of a stock is also dependent on the perceived risk. Therefore investors must keep themselves informed about the risks involved before investing in any company. You can see the 2 risks we have identified for GnCenergy by visiting our risks dashboard for free on our platform here.
New: Manage All Your Stock Portfolios in One Place
We've created the ultimate portfolio companion for stock investors, and it's free.
• Connect an unlimited number of Portfolios and see your total in one currency
• Be alerted to new Warning Signs or Risks via email or mobile
• Track the Fair Value of your stocks
Have feedback on this article? Concerned about the content? Get in touch with us directly. Alternatively, email editorial-team (at) simplywallst.com.
This article by Simply Wall St is general in nature. We provide commentary based on historical data and analyst forecasts only using an unbiased methodology and our articles are not intended to be financial advice. It does not constitute a recommendation to buy or sell any stock, and does not take account of your objectives, or your financial situation. We aim to bring you long-term focused analysis driven by fundamental data. Note that our analysis may not factor in the latest price-sensitive company announcements or qualitative material. Simply Wall St has no position in any stocks mentioned.
About KOSDAQ:A119850
GnCenergy
Engages in the manufacture and sale of power generators in Korea.
Solid track record with excellent balance sheet.
Market Insights

Community Narratives

