
Advertisement
- South Korea
- /
- Machinery
- /
- KOSDAQ:A054180
What You Can Learn From MEDICOX Co., Ltd.'s (KOSDAQ:054180) P/S After Its 29% Share Price Crash

Unfortunately for some shareholders, the MEDICOX Co., Ltd. (KOSDAQ:054180) share price has dived 29% in the last thirty days, prolonging recent pain. For any long-term shareholders, the last month ends a year to forget by locking in a 74% share price decline.
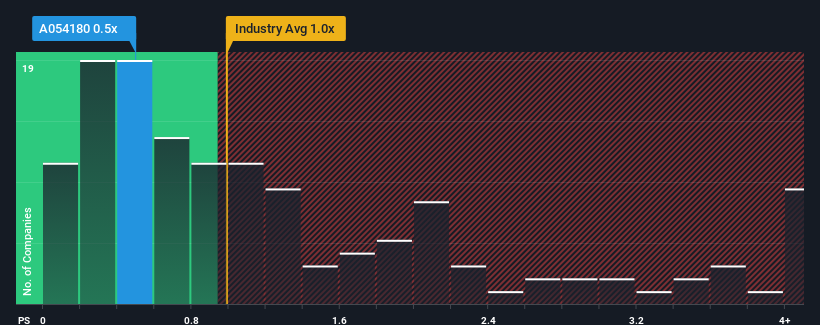
Even after such a large drop in price, it's still not a stretch to say that MEDICOX's price-to-sales (or "P/S") ratio of 0.5x right now seems quite "middle-of-the-road" compared to the Machinery industry in Korea, where the median P/S ratio is around 1x. Although, it's not wise to simply ignore the P/S without explanation as investors may be disregarding a distinct opportunity or a costly mistake.
See our latest analysis for MEDICOX
How Has MEDICOX Performed Recently?
Revenue has risen firmly for MEDICOX recently, which is pleasing to see. Perhaps the market is expecting future revenue performance to only keep up with the broader industry, which has keeping the P/S in line with expectations. Those who are bullish on MEDICOX will be hoping that this isn't the case, so that they can pick up the stock at a lower valuation.
Want the full picture on earnings, revenue and cash flow for the company? Then our free report on MEDICOX will help you shine a light on its historical performance.Is There Some Revenue Growth Forecasted For MEDICOX?
MEDICOX's P/S ratio would be typical for a company that's only expected to deliver moderate growth, and importantly, perform in line with the industry.
If we review the last year of revenue growth, the company posted a terrific increase of 26%. Pleasingly, revenue has also lifted 93% in aggregate from three years ago, thanks to the last 12 months of growth. Therefore, it's fair to say the revenue growth recently has been superb for the company.
It's interesting to note that the rest of the industry is similarly expected to grow by 27% over the next year, which is fairly even with the company's recent medium-term annualised growth rates.
With this information, we can see why MEDICOX is trading at a fairly similar P/S to the industry. Apparently shareholders are comfortable to simply hold on assuming the company will continue keeping a low profile.
What We Can Learn From MEDICOX's P/S?
MEDICOX's plummeting stock price has brought its P/S back to a similar region as the rest of the industry. We'd say the price-to-sales ratio's power isn't primarily as a valuation instrument but rather to gauge current investor sentiment and future expectations.
As we've seen, MEDICOX's three-year revenue trends seem to be contributing to its P/S, given they look similar to current industry expectations. With previous revenue trends that keep up with the current industry outlook, it's hard to justify the company's P/S ratio deviating much from it's current point. If recent medium-term revenue trends continue, it's hard to see the share price moving strongly in either direction in the near future under these circumstances.
It's always necessary to consider the ever-present spectre of investment risk. We've identified 5 warning signs with MEDICOX (at least 2 which are concerning), and understanding them should be part of your investment process.
If you're unsure about the strength of MEDICOX's business, why not explore our interactive list of stocks with solid business fundamentals for some other companies you may have missed.
New: Manage All Your Stock Portfolios in One Place
We've created the ultimate portfolio companion for stock investors, and it's free.
• Connect an unlimited number of Portfolios and see your total in one currency
• Be alerted to new Warning Signs or Risks via email or mobile
• Track the Fair Value of your stocks
Have feedback on this article? Concerned about the content? Get in touch with us directly. Alternatively, email editorial-team (at) simplywallst.com.
This article by Simply Wall St is general in nature. We provide commentary based on historical data and analyst forecasts only using an unbiased methodology and our articles are not intended to be financial advice. It does not constitute a recommendation to buy or sell any stock, and does not take account of your objectives, or your financial situation. We aim to bring you long-term focused analysis driven by fundamental data. Note that our analysis may not factor in the latest price-sensitive company announcements or qualitative material. Simply Wall St has no position in any stocks mentioned.
About KOSDAQ:A054180
MEDICOX
Operates in the shipbuilding equipment, electric motor, and generator businesses in South Korea and internationally.
Excellent balance sheet slight.
Market Insights

Advertisement
Community Narratives

Apple: A Dying Star with an Overpriced Valuation
Fair Value US$177.34|19.7% overvalued
IN
Community Contributor
Avino a case for USD$20 per share within 5 years (assuming $3,500 gold, $100 silver and $4 copper).
Fair Value CA$26.79|87.9% undervalued
AG
Community Contributor
Riding the Defense Boom RENK Sees Revenue Climb at 15% CAGR by FY 2029
Fair Value €69.87|24.5% undervalued
CH
Community Contributor