- South Korea
- /
- Construction
- /
- KOSDAQ:A042940
It's Down 28% But Sangji Construction, Inc. (KOSDAQ:042940) Could Be Riskier Than It Looks


The Sangji Construction, Inc. (KOSDAQ:042940) share price has fared very poorly over the last month, falling by a substantial 28%. For any long-term shareholders, the last month ends a year to forget by locking in a 52% share price decline.
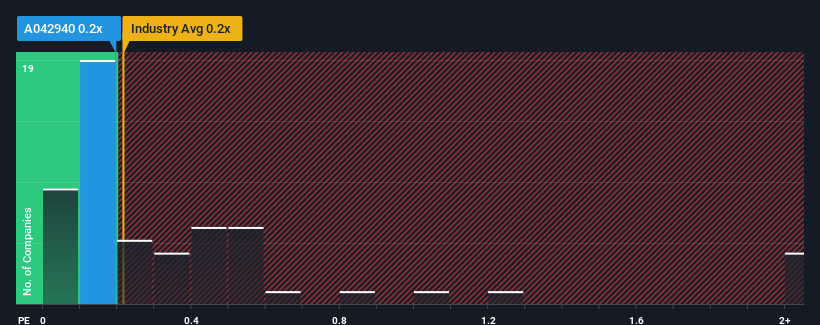
Even after such a large drop in price, there still wouldn't be many who think Sangji Construction's price-to-sales (or "P/S") ratio of 0.2x is worth a mention when it essentially matches the median P/S in Korea's Construction industry. However, investors might be overlooking a clear opportunity or potential setback if there is no rational basis for the P/S.
Check out our latest analysis for Sangji Construction
What Does Sangji Construction's Recent Performance Look Like?
With revenue growth that's exceedingly strong of late, Sangji Construction has been doing very well. Perhaps the market is expecting future revenue performance to taper off, which has kept the P/S from rising. Those who are bullish on Sangji Construction will be hoping that this isn't the case, so that they can pick up the stock at a lower valuation.
Want the full picture on earnings, revenue and cash flow for the company? Then our free report on Sangji Construction will help you shine a light on its historical performance.Do Revenue Forecasts Match The P/S Ratio?
Sangji Construction's P/S ratio would be typical for a company that's only expected to deliver moderate growth, and importantly, perform in line with the industry.
Retrospectively, the last year delivered an exceptional 94% gain to the company's top line. This great performance means it was also able to deliver immense revenue growth over the last three years. Accordingly, shareholders would have been over the moon with those medium-term rates of revenue growth.
Comparing that to the industry, which is only predicted to deliver 2.1% growth in the next 12 months, the company's momentum is stronger based on recent medium-term annualised revenue results.
In light of this, it's curious that Sangji Construction's P/S sits in line with the majority of other companies. It may be that most investors are not convinced the company can maintain its recent growth rates.
The Bottom Line On Sangji Construction's P/S
With its share price dropping off a cliff, the P/S for Sangji Construction looks to be in line with the rest of the Construction industry. Generally, our preference is to limit the use of the price-to-sales ratio to establishing what the market thinks about the overall health of a company.
We didn't quite envision Sangji Construction's P/S sitting in line with the wider industry, considering the revenue growth over the last three-year is higher than the current industry outlook. It'd be fair to assume that potential risks the company faces could be the contributing factor to the lower than expected P/S. At least the risk of a price drop looks to be subdued if recent medium-term revenue trends continue, but investors seem to think future revenue could see some volatility.
You should always think about risks. Case in point, we've spotted 4 warning signs for Sangji Construction you should be aware of, and 1 of them can't be ignored.
If strong companies turning a profit tickle your fancy, then you'll want to check out this free list of interesting companies that trade on a low P/E (but have proven they can grow earnings).
If you're looking to trade Sangji Construction, open an account with the lowest-cost platform trusted by professionals, Interactive Brokers.
With clients in over 200 countries and territories, and access to 160 markets, IBKR lets you trade stocks, options, futures, forex, bonds and funds from a single integrated account.
Enjoy no hidden fees, no account minimums, and FX conversion rates as low as 0.03%, far better than what most brokers offer.
Sponsored ContentNew: Manage All Your Stock Portfolios in One Place
We've created the ultimate portfolio companion for stock investors, and it's free.
• Connect an unlimited number of Portfolios and see your total in one currency
• Be alerted to new Warning Signs or Risks via email or mobile
• Track the Fair Value of your stocks
Have feedback on this article? Concerned about the content? Get in touch with us directly. Alternatively, email editorial-team (at) simplywallst.com.
This article by Simply Wall St is general in nature. We provide commentary based on historical data and analyst forecasts only using an unbiased methodology and our articles are not intended to be financial advice. It does not constitute a recommendation to buy or sell any stock, and does not take account of your objectives, or your financial situation. We aim to bring you long-term focused analysis driven by fundamental data. Note that our analysis may not factor in the latest price-sensitive company announcements or qualitative material. Simply Wall St has no position in any stocks mentioned.
About KOSDAQ:A042940
Excellent balance sheet minimal.
Market Insights

Community Narratives


