

If you're not sure where to start when looking for the next multi-bagger, there are a few key trends you should keep an eye out for. Ideally, a business will show two trends; firstly a growing return on capital employed (ROCE) and secondly, an increasing amount of capital employed. Ultimately, this demonstrates that it's a business that is reinvesting profits at increasing rates of return. So when we looked at Sangji Caelum (KOSDAQ:042940) and its trend of ROCE, we really liked what we saw.
Return On Capital Employed (ROCE): What is it?
For those that aren't sure what ROCE is, it measures the amount of pre-tax profits a company can generate from the capital employed in its business. Analysts use this formula to calculate it for Sangji Caelum:
Return on Capital Employed = Earnings Before Interest and Tax (EBIT) ÷ (Total Assets - Current Liabilities)
0.14 = ₩7.9b ÷ (₩175b - ₩116b) (Based on the trailing twelve months to September 2020).
So, Sangji Caelum has an ROCE of 14%. On its own, that's a standard return, however it's much better than the 9.2% generated by the Construction industry.
See our latest analysis for Sangji Caelum
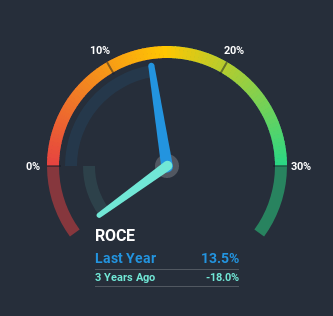
Historical performance is a great place to start when researching a stock so above you can see the gauge for Sangji Caelum's ROCE against it's prior returns. If you want to delve into the historical earnings, revenue and cash flow of Sangji Caelum, check out these free graphs here.
What Can We Tell From Sangji Caelum's ROCE Trend?
Sangji Caelum has recently broken into profitability so their prior investments seem to be paying off. The company was generating losses four years ago, but now it's earning 14% which is a sight for sore eyes. And unsurprisingly, like most companies trying to break into the black, Sangji Caelum is utilizing 959% more capital than it was four years ago. This can tell us that the company has plenty of reinvestment opportunities that are able to generate higher returns.
On a separate but related note, it's important to know that Sangji Caelum has a current liabilities to total assets ratio of 67%, which we'd consider pretty high. This effectively means that suppliers (or short-term creditors) are funding a large portion of the business, so just be aware that this can introduce some elements of risk. While it's not necessarily a bad thing, it can be beneficial if this ratio is lower.The Bottom Line On Sangji Caelum's ROCE
Long story short, we're delighted to see that Sangji Caelum's reinvestment activities have paid off and the company is now profitable. Considering the stock has delivered 6.6% to its stockholders over the last five years, it may be fair to think that investors aren't fully aware of the promising trends yet. So with that in mind, we think the stock deserves further research.
Since virtually every company faces some risks, it's worth knowing what they are, and we've spotted 4 warning signs for Sangji Caelum (of which 1 can't be ignored!) that you should know about.
While Sangji Caelum isn't earning the highest return, check out this free list of companies that are earning high returns on equity with solid balance sheets.
If you’re looking to trade Sangji Caelum, open an account with the lowest-cost* platform trusted by professionals, Interactive Brokers. Their clients from over 200 countries and territories trade stocks, options, futures, forex, bonds and funds worldwide from a single integrated account. Promoted
If you're looking to trade Sangji Construction, open an account with the lowest-cost platform trusted by professionals, Interactive Brokers.
With clients in over 200 countries and territories, and access to 160 markets, IBKR lets you trade stocks, options, futures, forex, bonds and funds from a single integrated account.
Enjoy no hidden fees, no account minimums, and FX conversion rates as low as 0.03%, far better than what most brokers offer.
Sponsored ContentNew: Manage All Your Stock Portfolios in One Place
We've created the ultimate portfolio companion for stock investors, and it's free.
• Connect an unlimited number of Portfolios and see your total in one currency
• Be alerted to new Warning Signs or Risks via email or mobile
• Track the Fair Value of your stocks
This article by Simply Wall St is general in nature. It does not constitute a recommendation to buy or sell any stock, and does not take account of your objectives, or your financial situation. We aim to bring you long-term focused analysis driven by fundamental data. Note that our analysis may not factor in the latest price-sensitive company announcements or qualitative material. Simply Wall St has no position in any stocks mentioned.
*Interactive Brokers Rated Lowest Cost Broker by StockBrokers.com Annual Online Review 2020
Have feedback on this article? Concerned about the content? Get in touch with us directly. Alternatively, email editorial-team@simplywallst.com.
About KOSDAQ:A042940
Excellent balance sheet minimal.
Market Insights

Community Narratives


