- South Korea
- /
- Auto Components
- /
- KOSE:A012330
Is Hyundai Mobis Co.,Ltd (KRX:012330) Trading At A 26% Discount?


Key Insights
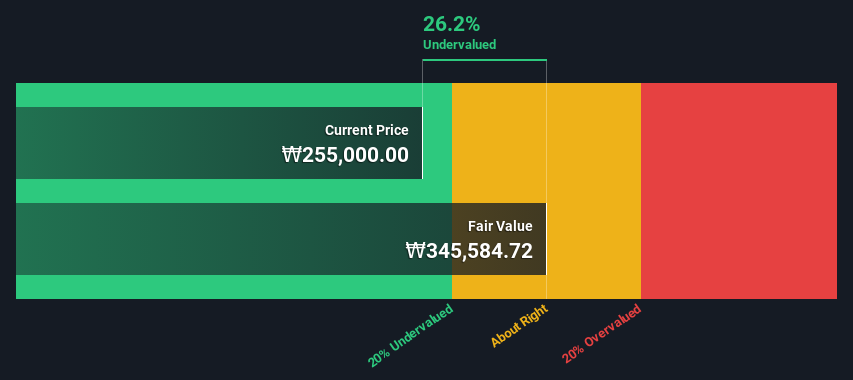
- The projected fair value for Hyundai MobisLtd is ₩345,585 based on 2 Stage Free Cash Flow to Equity
- Current share price of ₩255,000 suggests Hyundai MobisLtd is potentially 26% undervalued
- Our fair value estimate is 21% higher than Hyundai MobisLtd's analyst price target of ₩285,833
How far off is Hyundai Mobis Co.,Ltd (KRX:012330) from its intrinsic value? Using the most recent financial data, we'll take a look at whether the stock is fairly priced by taking the forecast future cash flows of the company and discounting them back to today's value. One way to achieve this is by employing the Discounted Cash Flow (DCF) model. Believe it or not, it's not too difficult to follow, as you'll see from our example!
Companies can be valued in a lot of ways, so we would point out that a DCF is not perfect for every situation. Anyone interested in learning a bit more about intrinsic value should have a read of the Simply Wall St analysis model.
View our latest analysis for Hyundai MobisLtd
What's The Estimated Valuation?
We're using the 2-stage growth model, which simply means we take in account two stages of company's growth. In the initial period the company may have a higher growth rate and the second stage is usually assumed to have a stable growth rate. To start off with, we need to estimate the next ten years of cash flows. Where possible we use analyst estimates, but when these aren't available we extrapolate the previous free cash flow (FCF) from the last estimate or reported value. We assume companies with shrinking free cash flow will slow their rate of shrinkage, and that companies with growing free cash flow will see their growth rate slow, over this period. We do this to reflect that growth tends to slow more in the early years than it does in later years.
Generally we assume that a dollar today is more valuable than a dollar in the future, and so the sum of these future cash flows is then discounted to today's value:
10-year free cash flow (FCF) estimate
| 2024 | 2025 | 2026 | 2027 | 2028 | 2029 | 2030 | 2031 | 2032 | 2033 | |
| Levered FCF (₩, Millions) | ₩807.5b | ₩2.10t | ₩2.20t | ₩2.29t | ₩2.37t | ₩2.45t | ₩2.52t | ₩2.59t | ₩2.66t | ₩2.73t |
| Growth Rate Estimate Source | Analyst x10 | Analyst x12 | Est @ 4.69% | Est @ 4.00% | Est @ 3.53% | Est @ 3.19% | Est @ 2.96% | Est @ 2.79% | Est @ 2.68% | Est @ 2.60% |
| Present Value (₩, Millions) Discounted @ 9.1% | ₩740.2k | ₩1.77m | ₩1.70m | ₩1.62m | ₩1.53m | ₩1.45m | ₩1.37m | ₩1.29m | ₩1.21m | ₩1.14m |
("Est" = FCF growth rate estimated by Simply Wall St)
Present Value of 10-year Cash Flow (PVCF) = ₩14t
After calculating the present value of future cash flows in the initial 10-year period, we need to calculate the Terminal Value, which accounts for all future cash flows beyond the first stage. The Gordon Growth formula is used to calculate Terminal Value at a future annual growth rate equal to the 5-year average of the 10-year government bond yield of 2.4%. We discount the terminal cash flows to today's value at a cost of equity of 9.1%.
Terminal Value (TV)= FCF2033 × (1 + g) ÷ (r – g) = ₩2.7t× (1 + 2.4%) ÷ (9.1%– 2.4%) = ₩42t
Present Value of Terminal Value (PVTV)= TV / (1 + r)10= ₩42t÷ ( 1 + 9.1%)10= ₩18t
The total value, or equity value, is then the sum of the present value of the future cash flows, which in this case is ₩31t. In the final step we divide the equity value by the number of shares outstanding. Compared to the current share price of ₩255k, the company appears a touch undervalued at a 26% discount to where the stock price trades currently. Valuations are imprecise instruments though, rather like a telescope - move a few degrees and end up in a different galaxy. Do keep this in mind.
Important Assumptions
We would point out that the most important inputs to a discounted cash flow are the discount rate and of course the actual cash flows. If you don't agree with these result, have a go at the calculation yourself and play with the assumptions. The DCF also does not consider the possible cyclicality of an industry, or a company's future capital requirements, so it does not give a full picture of a company's potential performance. Given that we are looking at Hyundai MobisLtd as potential shareholders, the cost of equity is used as the discount rate, rather than the cost of capital (or weighted average cost of capital, WACC) which accounts for debt. In this calculation we've used 9.1%, which is based on a levered beta of 1.256. Beta is a measure of a stock's volatility, compared to the market as a whole. We get our beta from the industry average beta of globally comparable companies, with an imposed limit between 0.8 and 2.0, which is a reasonable range for a stable business.
SWOT Analysis for Hyundai MobisLtd
- Earnings growth over the past year exceeded the industry.
- Debt is not viewed as a risk.
- Dividends are covered by earnings and cash flows.
- Dividend is low compared to the top 25% of dividend payers in the Auto Components market.
- Annual earnings are forecast to grow for the next 3 years.
- Good value based on P/E ratio and estimated fair value.
- Annual earnings are forecast to grow slower than the South Korean market.
Moving On:
Although the valuation of a company is important, it ideally won't be the sole piece of analysis you scrutinize for a company. It's not possible to obtain a foolproof valuation with a DCF model. Preferably you'd apply different cases and assumptions and see how they would impact the company's valuation. For instance, if the terminal value growth rate is adjusted slightly, it can dramatically alter the overall result. Can we work out why the company is trading at a discount to intrinsic value? For Hyundai MobisLtd, there are three essential items you should further research:
- Risks: Take risks, for example - Hyundai MobisLtd has 1 warning sign we think you should be aware of.
- Future Earnings: How does A012330's growth rate compare to its peers and the wider market? Dig deeper into the analyst consensus number for the upcoming years by interacting with our free analyst growth expectation chart.
- Other High Quality Alternatives: Do you like a good all-rounder? Explore our interactive list of high quality stocks to get an idea of what else is out there you may be missing!
PS. The Simply Wall St app conducts a discounted cash flow valuation for every stock on the KOSE every day. If you want to find the calculation for other stocks just search here.
Valuation is complex, but we're here to simplify it.
Discover if Hyundai MobisLtd might be undervalued or overvalued with our detailed analysis, featuring fair value estimates, potential risks, dividends, insider trades, and its financial condition.
Access Free AnalysisHave feedback on this article? Concerned about the content? Get in touch with us directly. Alternatively, email editorial-team (at) simplywallst.com.
This article by Simply Wall St is general in nature. We provide commentary based on historical data and analyst forecasts only using an unbiased methodology and our articles are not intended to be financial advice. It does not constitute a recommendation to buy or sell any stock, and does not take account of your objectives, or your financial situation. We aim to bring you long-term focused analysis driven by fundamental data. Note that our analysis may not factor in the latest price-sensitive company announcements or qualitative material. Simply Wall St has no position in any stocks mentioned.
About KOSE:A012330
Hyundai MobisLtd
Engages in the auto parts business in Korea, China, the United States, Europe, and internationally.
Flawless balance sheet and undervalued.

