Advertisement
- Japan
- /
- Gas Utilities
- /
- TSE:9532
Is Osaka Gas Still Attractive After Surging 34% and Japan’s LNG Import Shift?

Simply Wall St
Reviewed by Simply Wall St
If you’ve been watching Osaka Gas and wondering if it’s time to make a move, you’re in good company. With the stock closing recently at 4,372.0 and delivering an impressive return of 34.2% over the past year, there’s a buzz among investors about whether the momentum can continue. The returns over the past three and five years, up 107.1% and 141.4% respectively, highlight just how much long-term potential this utility player has shown. Recent gains, such as a 1.7% jump over the last week and 3.7% over the last month, reflect changing perceptions of risk and opportunity. These may be tied to shifting energy markets and renewed focus on infrastructure stability in Japan.
But before you make a call, it’s worth diving into Osaka Gas’s current valuation. Many investors use a checklist of six valuation criteria to spot bargains. On that front, Osaka Gas gets a score of 2, indicating it currently meets two checks for being undervalued out of six. That’s not headline-grabbing undervaluation, but it does suggest there are areas where the stock may offer decent value if you dig deeper.
The big question, of course, is how these different valuation approaches stack up, and if they tell the whole story. In the upcoming sections, we’ll walk through each method, discuss what they signal about Osaka Gas right now, and finish with a fresh perspective for truly sizing up this company’s worth.
Osaka Gas scores just 2/6 on our valuation checks. See what other red flags we found in the full valuation breakdown.Approach 1: Osaka Gas Discounted Cash Flow (DCF) Analysis
A Discounted Cash Flow (DCF) model estimates a company's intrinsic value by projecting its future cash flows and discounting them back to today’s value. This method helps investors gauge what the business could be worth if those future cash flows materialize as expected.
For Osaka Gas, the latest twelve months saw Free Cash Flow (FCF) at ¥89.38 billion. Analyst estimates suggest FCF will be ¥61.15 billion in 2026, gradually declining and then rebounding to ¥31.10 billion by 2030. It is important to note that while analyst forecasts typically extend out five years, future figures beyond that, such as for 2031 and beyond, are extrapolated based on growth assumptions rather than direct analyst predictions.
Using the 2 Stage Free Cash Flow to Equity model, the DCF approach calculates an intrinsic value of ¥1,954.70 per share. With the current market price at ¥4,372.0, this implies Osaka Gas is trading at a 123.7% premium to its estimated fair value based on future cash flows.
Result: OVERVALUED
Head to the Valuation section of our Company Report for more details on how we arrive at this Fair Value for Osaka Gas.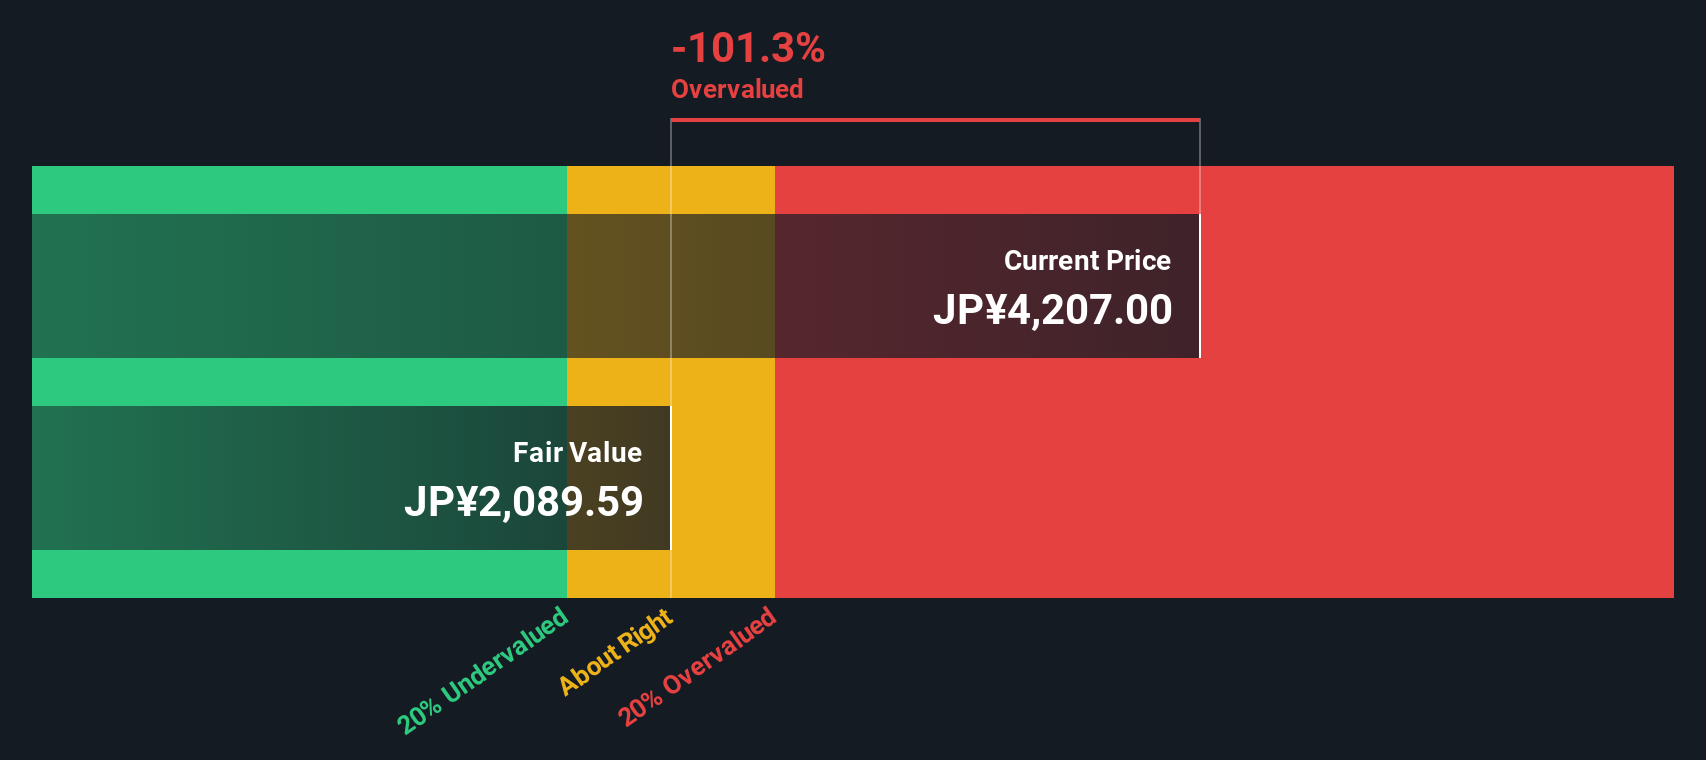
Approach 2: Osaka Gas Price vs Earnings (PE Ratio)
For profitable companies like Osaka Gas, the Price-to-Earnings (PE) ratio is a tried-and-true metric to gauge valuation. The PE ratio captures how much investors are willing to pay for each unit of current earnings, helping to frame whether the stock is expensive compared to its underlying profitability.
What counts as a “normal” or “fair” PE ratio isn’t fixed. Growth expectations often push PE ratios higher because investors pay up for companies with strong future prospects. Conversely, greater uncertainty or industry risks usually result in a lower PE. This context is essential for meaningful comparisons.
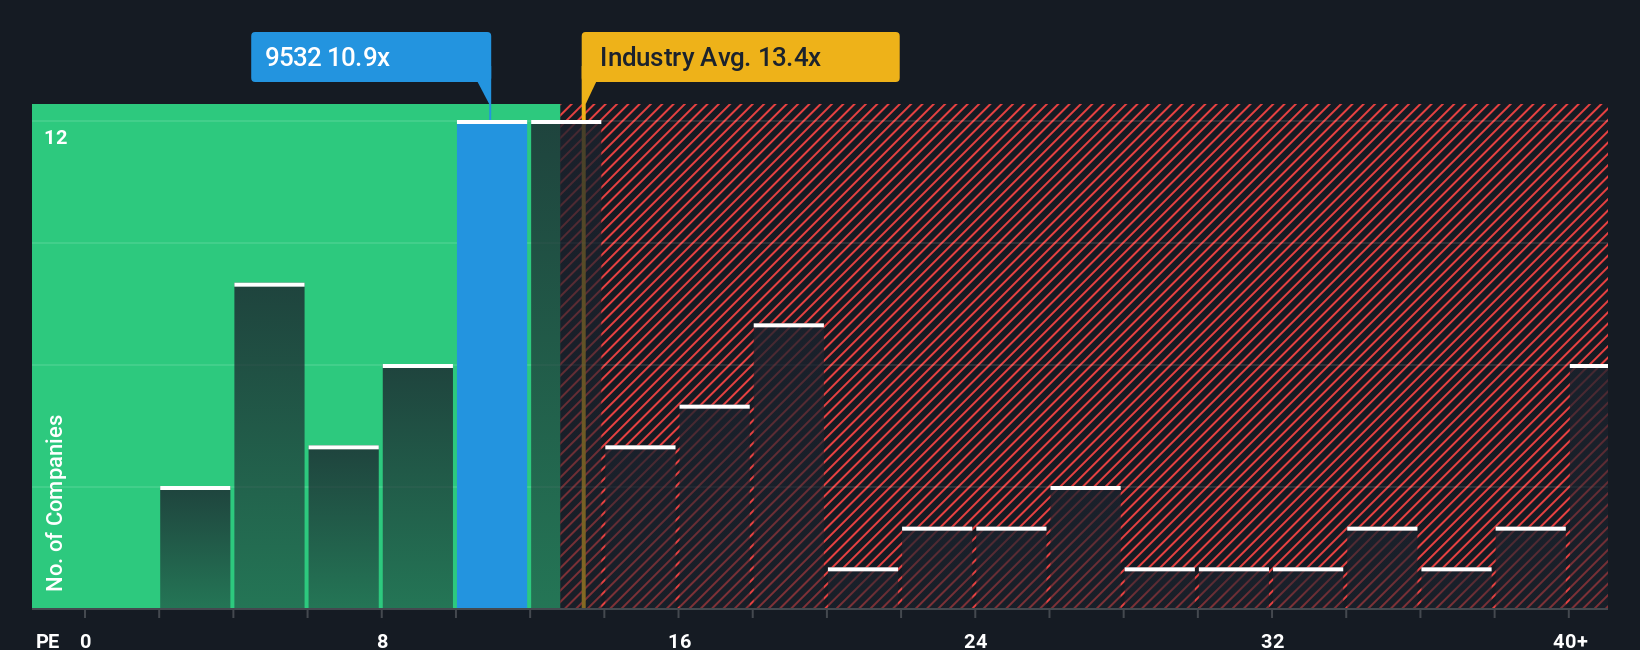
Currently, Osaka Gas trades at a PE of 11.30x. That’s below both its peer average of 16.13x and the Gas Utilities industry average of 13.34x. While that might suggest a bargain at first glance, it’s important to go deeper.
Simply Wall St’s “Fair Ratio” takes things further. Instead of just comparing to averages, it weighs Osaka Gas’ growth outlook, industry factors, profit margins, market cap, and risk profile. For Osaka Gas, the fair PE ratio calculates to 8.70x, which is lower than its current multiple. This approach is more nuanced as it adjusts for what really matters to investors, making it a more reliable guide than simple benchmarks.
With Osaka Gas currently trading above its Fair Ratio, the stock appears overvalued on this metric.
Result: OVERVALUED
Upgrade Your Decision Making: Choose your Osaka Gas Narrative
Earlier we mentioned that there is an even better way to understand valuation. Let’s introduce you to Narratives. A Narrative is a straightforward way to put your own story behind the numbers, combining your expectations for a company’s future revenue, earnings, and profit margins to create your personal fair value estimate.
With Narratives, you are connecting what you know or believe about a company’s prospects directly to a financial forecast and a real-time sense of fair value. This tool, available on Simply Wall St’s Community page and used by millions of investors, makes it easy to see whether your view signals a “buy” or “sell” by instantly comparing your Fair Value with the current market price.
The best part is that Narratives are dynamic, updating automatically when new information emerges, so you are always working with the freshest perspective. For example, some investors may see Osaka Gas as fairly valued at ¥1,954 per share based on conservative forecasts, while others forecast a much higher fair value thanks to optimistic growth assumptions. This all depends on their chosen Narrative.
Do you think there's more to the story for Osaka Gas? Create your own Narrative to let the Community know!
This article by Simply Wall St is general in nature. We provide commentary based on historical data and analyst forecasts only using an unbiased methodology and our articles are not intended to be financial advice. It does not constitute a recommendation to buy or sell any stock, and does not take account of your objectives, or your financial situation. We aim to bring you long-term focused analysis driven by fundamental data. Note that our analysis may not factor in the latest price-sensitive company announcements or qualitative material. Simply Wall St has no position in any stocks mentioned.
New: AI Stock Screener & Alerts
Our new AI Stock Screener scans the market every day to uncover opportunities.
• Dividend Powerhouses (3%+ Yield)
• Undervalued Small Caps with Insider Buying
• High growth Tech and AI Companies
Or build your own from over 50 metrics.
Have feedback on this article? Concerned about the content? Get in touch with us directly. Alternatively, email editorial-team@simplywallst.com
About TSE:9532
Osaka Gas
Provides gas, electricity, and other energy products and services in Japan and internationally.
Solid track record established dividend payer.
Similar Companies
Market Insights

Advertisement
Community Narratives
Quality at a Premium. A time to watch, not to buy?
Fair Value US$154.56|27.6% undervalued
DA
Community Contributor
GRAB: The Super-App at the Heart of Southeast Asia’s Digital Boom
Fair Value US$8.20|22.1% undervalued
BL
Community Contributor
Verve Group to Surge with 51.61% Revenue Growth
Fair Value €6.00|60.0% undervalued
ME
Community Contributor