
Advertisement
- Japan
- /
- Electric Utilities
- /
- TSE:9503
Kansai Electric Power Company's (TSE:9503) 40% CAGR outpaced the company's earnings growth over the same three-year period

The worst result, after buying shares in a company (assuming no leverage), would be if you lose all the money you put in. But when you pick a company that is really flourishing, you can make more than 100%. To wit, the The Kansai Electric Power Company, Incorporated (TSE:9503) share price has flown 147% in the last three years. Most would be happy with that. Also pleasing for shareholders was the 31% gain in the last three months. This could be related to the recent financial results, released recently - you can catch up on the most recent data by reading our company report.
The past week has proven to be lucrative for Kansai Electric Power Company investors, so let's see if fundamentals drove the company's three-year performance.
View our latest analysis for Kansai Electric Power Company
There is no denying that markets are sometimes efficient, but prices do not always reflect underlying business performance. One way to examine how market sentiment has changed over time is to look at the interaction between a company's share price and its earnings per share (EPS).
During three years of share price growth, Kansai Electric Power Company achieved compound earnings per share growth of 59% per year. This EPS growth is higher than the 35% average annual increase in the share price. So one could reasonably conclude that the market has cooled on the stock. This cautious sentiment is reflected in its (fairly low) P/E ratio of 5.18.
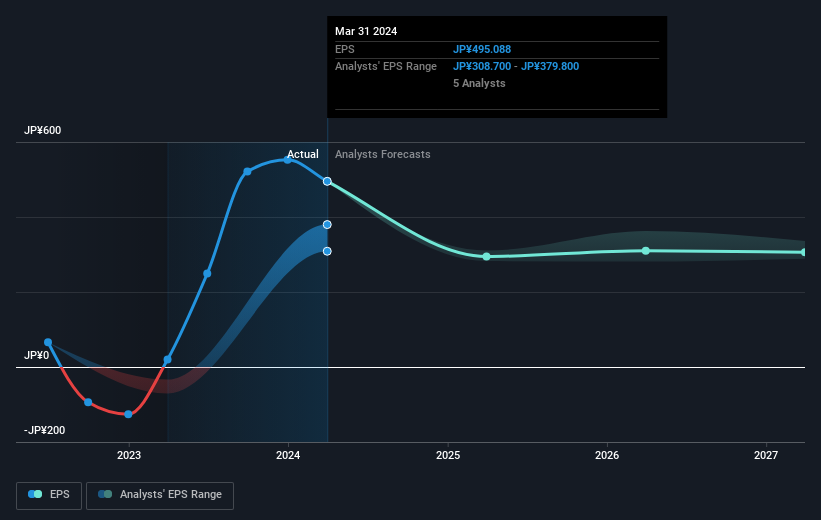
The graphic below depicts how EPS has changed over time (unveil the exact values by clicking on the image).
It is of course excellent to see how Kansai Electric Power Company has grown profits over the years, but the future is more important for shareholders. This free interactive report on Kansai Electric Power Company's balance sheet strength is a great place to start, if you want to investigate the stock further.
What About Dividends?
When looking at investment returns, it is important to consider the difference between total shareholder return (TSR) and share price return. Whereas the share price return only reflects the change in the share price, the TSR includes the value of dividends (assuming they were reinvested) and the benefit of any discounted capital raising or spin-off. Arguably, the TSR gives a more comprehensive picture of the return generated by a stock. As it happens, Kansai Electric Power Company's TSR for the last 3 years was 174%, which exceeds the share price return mentioned earlier. This is largely a result of its dividend payments!
A Different Perspective
It's nice to see that Kansai Electric Power Company shareholders have received a total shareholder return of 65% over the last year. Of course, that includes the dividend. That gain is better than the annual TSR over five years, which is 20%. Therefore it seems like sentiment around the company has been positive lately. In the best case scenario, this may hint at some real business momentum, implying that now could be a great time to delve deeper. It's always interesting to track share price performance over the longer term. But to understand Kansai Electric Power Company better, we need to consider many other factors. To that end, you should learn about the 3 warning signs we've spotted with Kansai Electric Power Company (including 1 which is a bit unpleasant) .
If you like to buy stocks alongside management, then you might just love this free list of companies. (Hint: many of them are unnoticed AND have attractive valuation).
Please note, the market returns quoted in this article reflect the market weighted average returns of stocks that currently trade on Japanese exchanges.
Valuation is complex, but we're here to simplify it.
Discover if Kansai Electric Power Company might be undervalued or overvalued with our detailed analysis, featuring fair value estimates, potential risks, dividends, insider trades, and its financial condition.
Access Free AnalysisHave feedback on this article? Concerned about the content? Get in touch with us directly. Alternatively, email editorial-team (at) simplywallst.com.
This article by Simply Wall St is general in nature. We provide commentary based on historical data and analyst forecasts only using an unbiased methodology and our articles are not intended to be financial advice. It does not constitute a recommendation to buy or sell any stock, and does not take account of your objectives, or your financial situation. We aim to bring you long-term focused analysis driven by fundamental data. Note that our analysis may not factor in the latest price-sensitive company announcements or qualitative material. Simply Wall St has no position in any stocks mentioned.
About TSE:9503
Kansai Electric Power Company
Engages in electricity, gas and heat supply, and telecommunication businesses in Japan.
Good value with mediocre balance sheet.
Market Insights

Advertisement
Community Narratives
Pinterest will surge as advertising innovations ignite revenue growth
Fair Value US$42.63|27.1% undervalued
BR
Community Contributor
Brambles' Revenue Set to Climb 14% with Profit Margins Following
Fair Value AU$21.90|4.9% overvalued
RO
Community Contributor
Challenging Future for STG as Organic Sales Decline by 8.8%
Fair Value DKK 116.13|26.8% undervalued
KA
Community Contributor