- Japan
- /
- Marine and Shipping
- /
- TSE:9310
Japan Transcity Corporation's (TSE:9310) Shares Leap 32% Yet They're Still Not Telling The Full Story


Despite an already strong run, Japan Transcity Corporation (TSE:9310) shares have been powering on, with a gain of 32% in the last thirty days. The last 30 days bring the annual gain to a very sharp 39%.
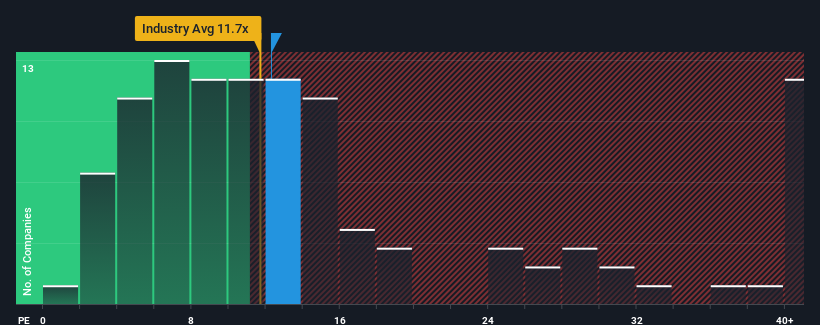
Although its price has surged higher, Japan Transcity may still be sending bullish signals at the moment with its price-to-earnings (or "P/E") ratio of 12.3x, since almost half of all companies in Japan have P/E ratios greater than 15x and even P/E's higher than 23x are not unusual. However, the P/E might be low for a reason and it requires further investigation to determine if it's justified.
For example, consider that Japan Transcity's financial performance has been poor lately as its earnings have been in decline. It might be that many expect the disappointing earnings performance to continue or accelerate, which has repressed the P/E. If you like the company, you'd be hoping this isn't the case so that you could potentially pick up some stock while it's out of favour.
Check out our latest analysis for Japan Transcity
How Is Japan Transcity's Growth Trending?
Japan Transcity's P/E ratio would be typical for a company that's only expected to deliver limited growth, and importantly, perform worse than the market.
Taking a look back first, the company's earnings per share growth last year wasn't something to get excited about as it posted a disappointing decline of 30%. Even so, admirably EPS has lifted 44% in aggregate from three years ago, notwithstanding the last 12 months. Accordingly, while they would have preferred to keep the run going, shareholders would probably welcome the medium-term rates of earnings growth.
This is in contrast to the rest of the market, which is expected to grow by 11% over the next year, materially lower than the company's recent medium-term annualised growth rates.
With this information, we find it odd that Japan Transcity is trading at a P/E lower than the market. It looks like most investors are not convinced the company can maintain its recent growth rates.
What We Can Learn From Japan Transcity's P/E?
Despite Japan Transcity's shares building up a head of steam, its P/E still lags most other companies. It's argued the price-to-earnings ratio is an inferior measure of value within certain industries, but it can be a powerful business sentiment indicator.
Our examination of Japan Transcity revealed its three-year earnings trends aren't contributing to its P/E anywhere near as much as we would have predicted, given they look better than current market expectations. When we see strong earnings with faster-than-market growth, we assume potential risks are what might be placing significant pressure on the P/E ratio. At least price risks look to be very low if recent medium-term earnings trends continue, but investors seem to think future earnings could see a lot of volatility.
There are also other vital risk factors to consider before investing and we've discovered 1 warning sign for Japan Transcity that you should be aware of.
If you're unsure about the strength of Japan Transcity's business, why not explore our interactive list of stocks with solid business fundamentals for some other companies you may have missed.
If you're looking to trade Japan Transcity, open an account with the lowest-cost platform trusted by professionals, Interactive Brokers.
With clients in over 200 countries and territories, and access to 160 markets, IBKR lets you trade stocks, options, futures, forex, bonds and funds from a single integrated account.
Enjoy no hidden fees, no account minimums, and FX conversion rates as low as 0.03%, far better than what most brokers offer.
Sponsored ContentNew: Manage All Your Stock Portfolios in One Place
We've created the ultimate portfolio companion for stock investors, and it's free.
• Connect an unlimited number of Portfolios and see your total in one currency
• Be alerted to new Warning Signs or Risks via email or mobile
• Track the Fair Value of your stocks
Have feedback on this article? Concerned about the content? Get in touch with us directly. Alternatively, email editorial-team (at) simplywallst.com.
This article by Simply Wall St is general in nature. We provide commentary based on historical data and analyst forecasts only using an unbiased methodology and our articles are not intended to be financial advice. It does not constitute a recommendation to buy or sell any stock, and does not take account of your objectives, or your financial situation. We aim to bring you long-term focused analysis driven by fundamental data. Note that our analysis may not factor in the latest price-sensitive company announcements or qualitative material. Simply Wall St has no position in any stocks mentioned.
About TSE:9310
Japan Transcity
Engages in logistics business in Japan and internationally.
6 star dividend payer with solid track record.

